1. Home
  2. Markets Updates
  3. GBP/USD Eyes Uptrend; Key Economic Data Ahead

GBP/USD Eyes Uptrend; Key Economic Data Ahead

25 January 2024

Share the article:


GBPUSD_Pro'H1.png
GBP/USD 1-Hour Timeframe, 25 January 2024


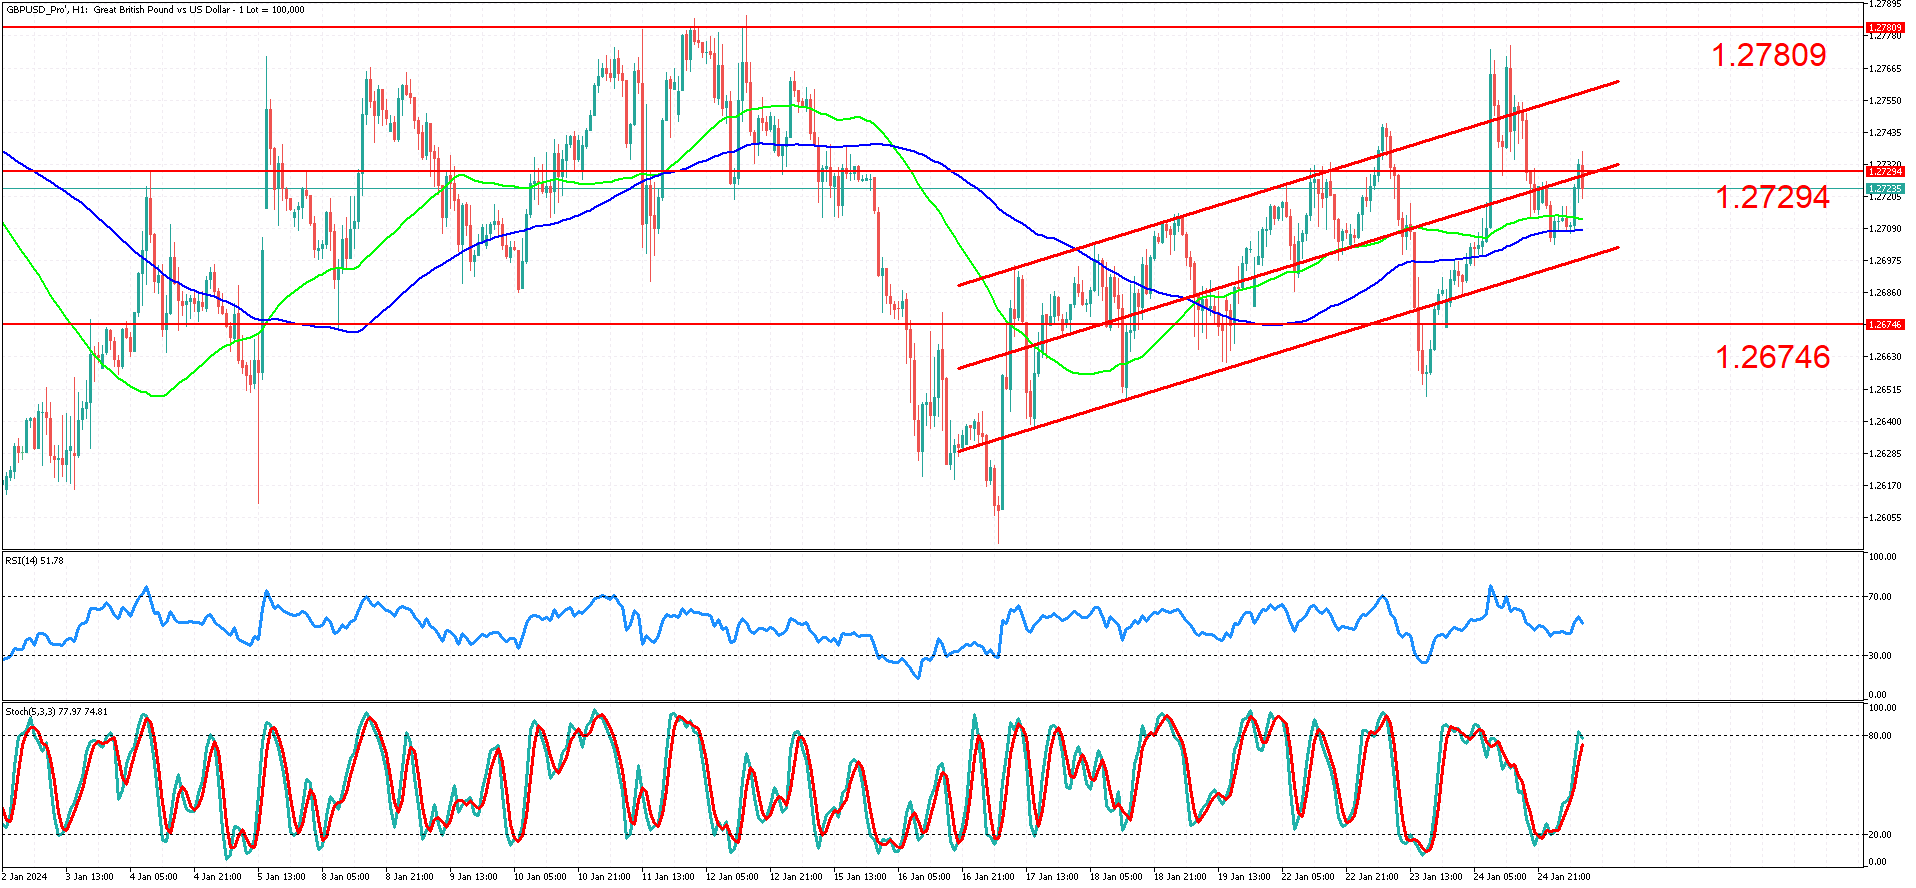
The GBP/USD, on an hourly timeframe, has been trading in a contained range between the 1.26 and 1.28 levels, with a recent pullback to the 1.26 level on 17 January 2024. This marked the start of a gradual uptrend, depicted on the chart with a regression channel.

Regression channels are powerful tools that greatly simplify the analysis process by reducing noise and giving the trader an overall sense of where the market might be heading next by simply looking at the slope of the channel. In this case, we favor an upward move for the GBPUSD since the channel is sloping upward.

However, this is not where the channel's usefulness ends. Despite the longer-term direction, we also have relative values that can act as potential buy and sell zones. For instance, we want to buy cheap (low) in an upward-sloping channel. This gives us, statistically, the greatest potential for a large risk-reward trade.

In our case today, GBPUSD is in the middle of the channel at the 1.27294 resistance level. Judging by the current candlesticks in this area, it does signal some indecision.

Next, we take a look at the other indicators on the chart to derive some possible scenarios. The 50-period simple moving average (Green) and the 100-period simple moving average (Blue) confirm an upward bias for the longer term future.

The 14-period RSI is in neutral territory, and the stochastic oscillator is overbought, signaling a potential move to the downside.

To bring all of this together, we favor a move to the upside in the longer term. However, the market is currently indecisive, probably waiting for the myriad of USD news being released later today: Advance GDP q/q, Unemployment Claims, and Core Durable Goods Orders m/m, to name a few.

This will likely cause a breakout of the current indecision. If the market starts closing lower with conviction, we might have some buying opportunities at the low of the channel or at the 1.26746 level. As long as the market maintains above the 1.26746 level, we can maintain an upward bias.

However, if the market starts closing below the crucial 1.26746 level with conviction, that will most likely invalidate the upward bias, and we can start siding with the bears, aiming for the 17 January low.

However, it remains to be seen what the news releases of later the day will hold for the battle between the bulls and bears.

Summary:

  • The market exhibits a steady upward movement within a contained and low-volatility channel.
  • The predominant long-term outlook is bullish, with a target set at 1.27809.
  • A potential entry point is identified if the market breaks above the 1.27294 level, signaling a strong bullish trend.
  • Another entry strategy is to enter during a market dip, provided it remains above the 1.26746 support level, utilizing tools like the RSI or Stochastic oscillators to guide entry timing.


IMPORTANT NOTICE: Any news, opinions, research, analyses, prices or other information contained in this article are provided as general market commentary and do not constitute investment advice. The market commentary has not been prepared in accordance with legal requirements designed to promote the independence of investment research, and therefore, it is not subject to any prohibition on dealing ahead of dissemination. Past performance is not an indication of possible future performance. Any action you take upon the information in this article is strictly at your own risk, and we will not be liable for any losses and damages in connection with the use of this article.
RISK WARNING: CFDs are complex instruments and come with a high risk of losing money rapidly due to leverage. A high percentage of retail client investors lose money when trading CFDs with this provider. You should consider whether you understand how CFDs work and whether you can afford to take the high risk of losing your money.

Related articles

GBPUSD Tests Key Technical Support Near 1.3240
17 July 2025
Sterling hovers above its 100-day moving average as GBPUSD traders watch for a bounce or breakdown. Get insights into key support levels, oversold signals, and market scenarios.

Read more

Gold Stalls Between 3250 and 3350 Awaiting a Breakout Trigger
10 July 2025
XAUUSD remains range bound with neutral momentum and declining volatility. Explore the technical outlook, key levels, and potential breakout scenarios for gold.

Read more

USDJPY Forms Contracting Triangle as Volatility Drops
3 July 2025
USDJPY price action tightens within a triangle pattern, signaling a potential breakout. With ATR falling and key data ahead, traders should watch support at 143 and resistance near 146–147.

Read more

Need Help? Visit our Help Section
Download NAGA Trader

Copyright © 2024 – All rights reserved.

NAGA is a trademark of The NAGA Group AG, a German based FinTech company publicly listed on the Frankfurt Stock Exchange | WKN: A161NR | ISIN: DE000A161NR7.

The website is operated by JME Financial Services (Pty) Ltd an authorised Financial Services Provider, regulated by the Financial Sector Conduct Authority in South Africa under license no. 37166. JME Financial Services (Pty) Ltd is located at Suite 10, 21 Lighthouse Rd 201 Beacon Rock, Umhlanga Rocks, Kwa-Zulu Natal, 4320, South Africa.

JME Financial Services (Pty) Ltd acts as an intermediary between the investor and NAGA Capital Ltd, the counterparty to the contract for difference purchased by the Investor via Naga.com/za. NAGA Capital Ltd is authorised and regulated by the Financial Services Authority Seychelles (FSA) under licence No. SD026. NAGA Capital Ltd is the principal to the CFD purchased by investors on this website. Other group entities: NAGA Markets Europe LTD which is authorised and regulated by the Cyprus Securities and Exchange Commission (CySEC) under licence No. 204/13.

RISK WARNING: Derivatives are complex instruments and come with a high risk of losing money rapidly due to leverage. You should consider whether you understand how derivatives work and whether you can afford to take the high risk of losing your money. The value of financial products can increase as well as decrease over time, depending on the value of the underlying securities and market conditions. Illustrations, forecasts or hypothetical data are not guaranteed and are provided for illustrative purposes only. JME Financial Services (Pty) Ltd does not render advice in respect of the CFD’s offered on this website. Before making an investment decision, you should rely on your own assessment. The Company’s disclaimer, conflict of interest policy are available on legal documents section.

Trading with NAGA Trader by following and/or copying or replicating the trades of other traders involves high levels of risks, even when following and/or copying or replicating the top-performing traders. Such risks include the risk that you may be following/copying the trading decisions of possibly inexperienced/unprofessional traders, or traders whose ultimate purpose or intention, or financial status may differ from yours. Before making an investment decision, you should rely on your own assessment of the person making the trading decisions and the terms of all the legal documentation.