


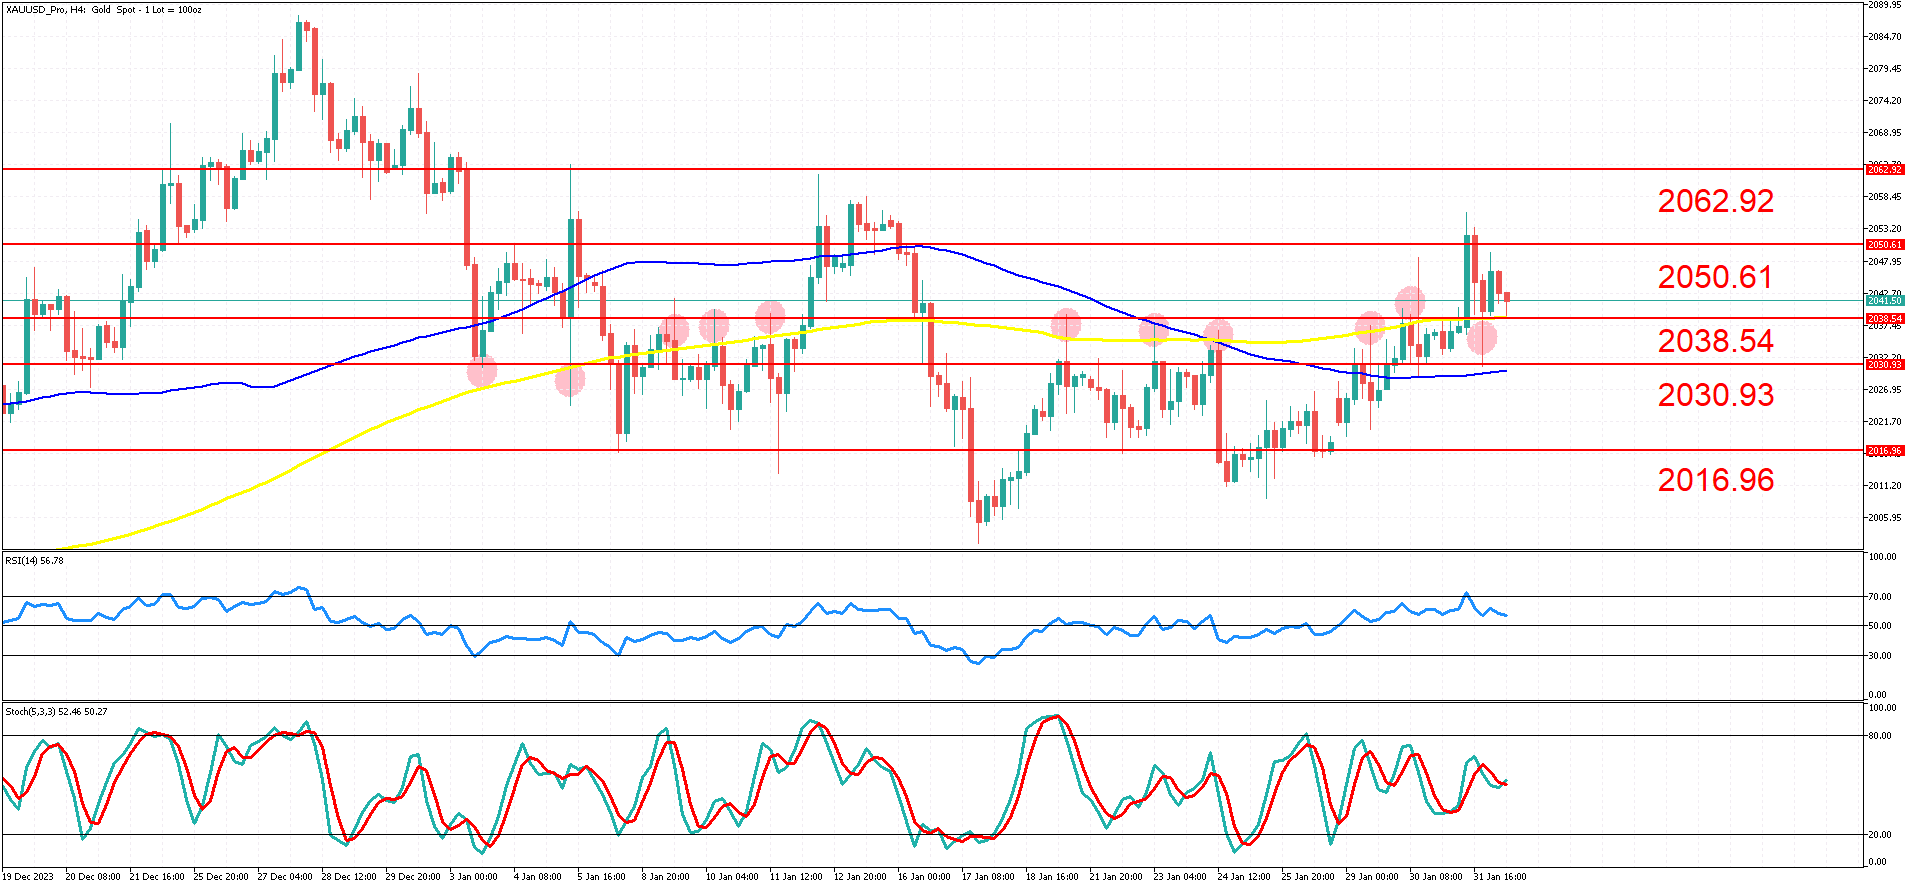
Gold ($XAUUSD) is currently trading within a 1000 pip range between the psychological levels of $2000 and $2100 on a 4-hour timeframe. Over the last week, gold showed a steady uptrend, peaking at $2050 before retracing to its current price of $2041.
Notably, the January 28 candle opened with a significant upward gap of 70 pips, shedding light on the trading behavior of major players over that weekend.
Key observations on the chart include the moving averages: the 100-period moving average is highlighted in blue, and the 200-period simple moving average (SMA) is in yellow. The 200-period SMA is notably well respected, with numerous instances of price touching and reversing off this moving average, as indicated by red circles on the chart.
This analysis aligns closely with the price range between $2030 and $2040, which has been identified as a strong supply and demand zone.
An additional clue to future price movements is the formation of a strong Hammer candlestick on January 31, with its lower wick testing both the 200-period SMA and the supply zone within the $2030 - $2040 range. This detail, coupled with the large gap, suggests a bullish inclination among major market participants.
The Stochastic oscillator remains undecided, without hitting recent overbought or oversold levels, indicating a period of indecision where the market is poised for new highs or lows.
Conversely, the RSI indicates a recent overbought condition, hinting at a potential market correction.
A breakout trade could be triggered by surpassing the recent high of $2050.61 or dropping below the low of $2030.93. Currently, the analysis leans towards an upward trend, but a breakout scenario seems more likely given the market's indecision. Thus, a breakout above $2050.61 could target the next major resistance at $2062.92, while a breach below $2030.93 might aim for the lower target of $2016.96.
It remains to be seen whether the market's major participants will continue to hold a bullish view on $XAUUSD.
Summary:
- Gold has shown a steady uptrend over the past week.
- The $2030 - $2040 level is a strong supply and demand zone.
- The upward trend, gap, and Hammer candlestick pattern suggest a potential bullish movement.
- In light of market indecision, a breakout is expected: surpassing $2050.61 may prompt buying towards $2062.92, while dropping below $2030 could lead to selling with a target of $2016.96.


