


In this lesson, we are going to dive into a famous trading pattern often used in technical analysis by all types of traders: the golden cross pattern. You could profit a lot by incorporating this element to your trading strategy, even if you don’t plan on relying on this pattern to place a trade. It will certainly give you a heads-up on where the market plans on going by giving you hints on the possible trend direction, allowing you to make the best decision when entering the market. This article will go over the golden cross pattern in detail, analyzing its different phases, its differences with the death cross, its limitations, and finally the most important thing: how to properly use and trade it in four different concrete trading strategies. Let’s get started!
What Is a Golden Cross?
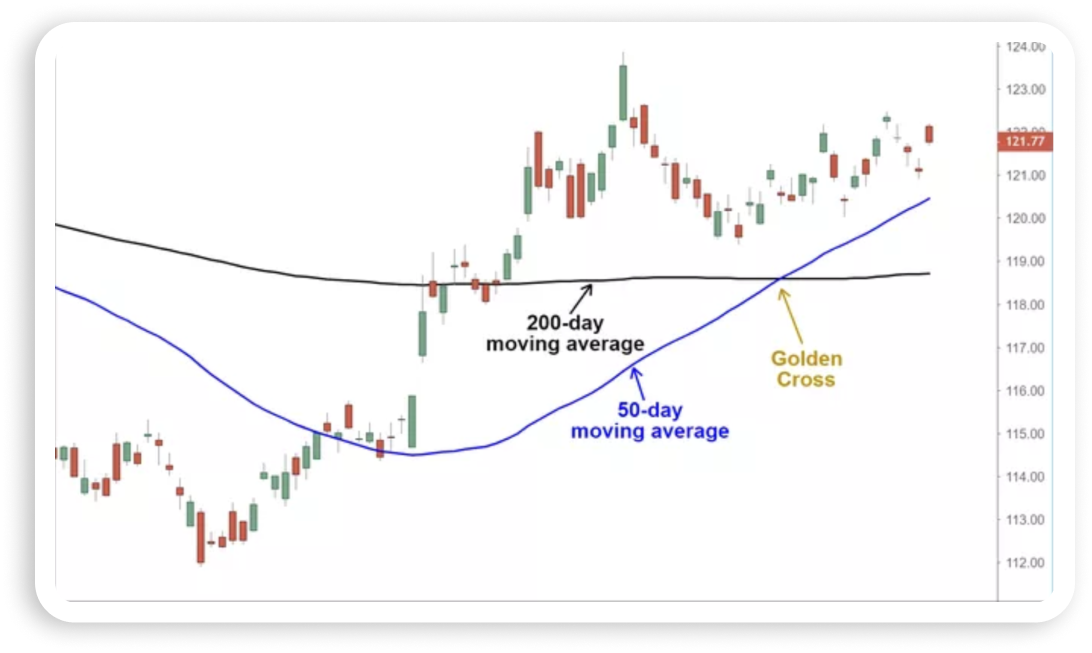
Before going further into the use of the golden cross in trading, it is important to comprehend the nature of this pattern. The golden cross is the crossing of two moving averages, a technical pattern indicative of the likelihood for prices to take a bullish turn. Specifically, it is when a short-term moving average, which reflects recent prices, rises above a long-term moving average, which is also the longer-term trend. Therefore, this shows that prices are gaining bullish momentum and is even more so the case when accompanied by high trading volumes.
Golden crosses are popular indicators watched by traders on different markets and gain traction especially with news headlines. This is largely attributed to the fact that this indicator is easy to follow, even though it may occur less frequently as an indication to take action as compared to other technical indicators. The most commonly used moving averages are the 50-day moving average (DMA) and the 200-DMA for the short and long term moving averages, respectively. Note that many do not use the golden cross as an indication to enter the market, instead placing a trade alone, and usually combining this indicator with others such as the relative strength index (RSI) or moving average convergence divergence (MACD) indicators, often used on most charts.
Although this pattern has been proven successful for several crypto assets and forex trading, the original golden cross trading strategy has its origins in the stock market. Thus, the main components of the golden cross pattern include two moving averages:
- 200-day moving average
- 50-day moving average
The 200-day MA is regarded as being one of the most popular, while the 50-day MA is a leading moving average.
Phases of Forming the Golden Cross
Appearances can often be deceiving and things are not as simple as they seem to be. This is why you shouldn’t underestimate any indicator or price pattern. While the crossing of moving averages may sound reasonably intuitive, technical analysts would highlight that there are three stages to the golden cross:
- Firstly, prior to the crossing of the moving averages, there exists a downtrend which also corresponds to the phenomenon whereby the short-term moving average had been traversing below the long-term trend.
- In the second stage, which is also the intersection, a new trend emerges whereby the short-term moving average takes over the long-term moving average, thus forming the golden cross.
- Finally, there needs to be a continuation, where the uptrend sustains and the short-term DMA acts as a support for prices. During this phase, the golden cross’s two moving averages should both act as support levels when corrective downside retracements occur. As long as both price and the 50-day average remain above the 200-day average, the bull market is considered as remaining intact.
What Does the Golden Cross Tell Traders?
As mentioned above, there are three stages to a golden cross. The first stage requires that a downtrend eventually bottoms out as selling is depleted. In the second stage, the shorter moving average forms a crossover up through the larger moving average to trigger a breakout and confirmation of trend reversal. The last stage is the continuing uptrend for the follow-through to higher prices.
As mentioned previously, the most commonly used moving averages are the 50-period and the 200-period moving average. The period represents a specific time increment.
So what does this tell us ? Generally, longer time periods tend to form longer-lasting breakouts. For example, the daily 50-day moving average crossover up through the 200-day moving average on an index like the S&P 500 is one of the most popular bullish market signals.
Learn how to adapt timeframes to your trading strategy:
Day traders commonly use smaller time periods like the 5-period and 15-period moving averages to trade intraday golden cross breakouts. The time interval of the charts can also be adjusted from 1 minute to weeks or months. Just remember, as larger periods make for stronger signals, the same applies to chart time periods as well. The larger the chart time frame, the stronger and longer-lasting the golden cross breakout tends to be.
Golden Cross vs. Death Cross
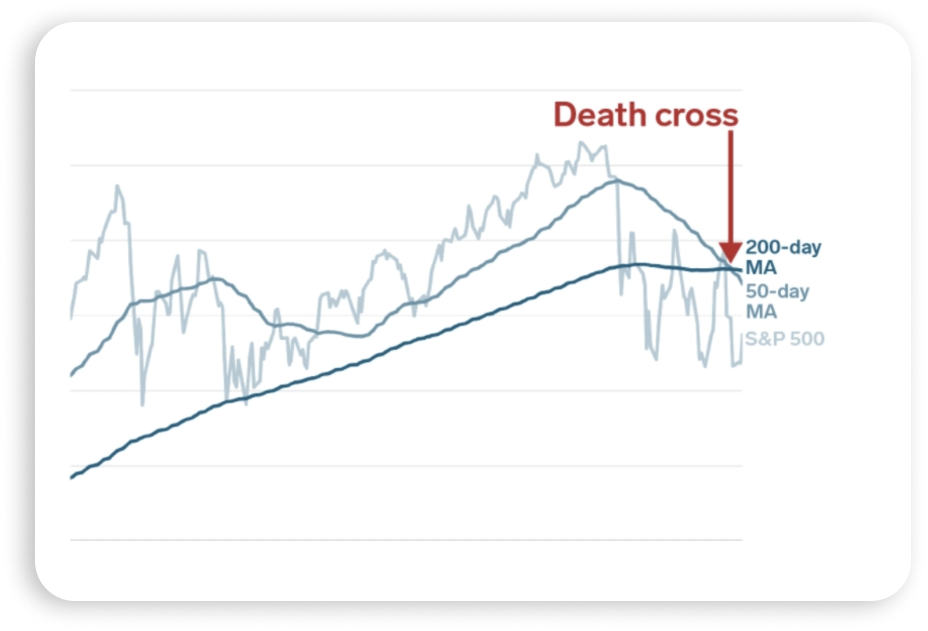
Now that you have a better understanding of the golden cross pattern, it is time to learn about a similar pattern, the death cross. However, the golden cross and death cross are exact opposites. A golden cross indicates a long-term bull market going forward, while a death cross signals a long-term bear market. Both refer to the solid confirmation of a long-term trend by the occurrence of a short-term moving average crossing over a major long-term moving average.
The golden cross occurs when a short-term moving average crosses over a major long-term moving average to the upside and is interpreted by analysts and traders as signaling a definitive upward turn in a market. In the same way, a similar downside moving average crossover constitutes the death cross and is understood to signal a decisive downturn in a market. Either crossover is considered more significant when accompanied by high trading volume.
Once the crossover occurs, the long-term moving average is considered a major support level (in the case of the golden cross) or resistance level (in the instance of the death cross) for the market from that point forward. Either cross may occur as a signal of a trend change, but they more frequently occur as a strong confirmation of a change in trend that has already taken place.
How to Use the Golden Cross
As a trader, it is now time you learned how you can trade the golden cross to help determine good times to both enter and exit the market. The indicator can also be a tool that you can use to help you better understand when it makes sense to sell and when it’s better for you to buy and hold.
Different traders will trade the golden cross differently according to their strategy and trading style. It is up to you to decide on if and how you are going to implement the golden cross in your trading:
- Traders looking to buy a security will sometimes enter the market when the security’s price rises above the 200-day moving average rather than waiting for the 50-day moving average to make the crossover. This is because the golden cross is often a significantly lagging indicator. It may not occur until well after the market has already turned from bearish to bullish.
- Some traders decide to use different moving averages to indicate a golden cross. For example, a trader might substitute the 100-day moving average in place of the 200-day. The pattern can also be looked for on shorter time frames, such as an hourly chart.
- Traders who sell short on the market may use the golden cross as a signal that the bear market is over and it’s time to exit their positions.
The golden cross is applied to trading both individual securities and market indexes such as the Dow Jones Industrial Average (DJIA).
The importance of confirmation
Many technical analysts use complementary technical indicators to confirm the indications suggested by a golden cross. Momentum indicators such as the Average Directional Index (ADX) or the Relative Strength Index (RSI) are popular choices. This is because momentum indicators are often leading, rather than lagging, indicators. Therefore, they can help in overcoming the cross pattern’s tendency to significantly lag behind price action.
Strategies to Trade the Golden Cross Pattern
Here are four of the most-used successful strategies using the golden cross pattern:
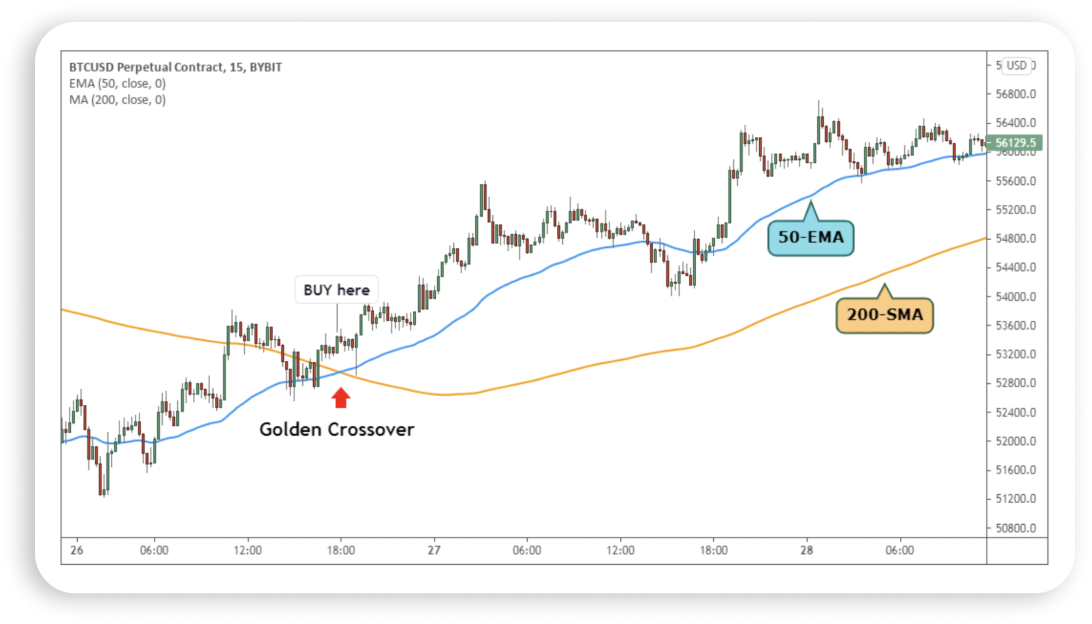
50 EMA Crosses Over the 200 SMA
This strategy is the most straightforward and one of the most effective of all due to its simplicity of execution. It is also recommended for beginners. Thus, in the golden cross, the most effective moving average values are the 50 EMA and 200 SMA.
We can see on the chart below how the price moves up with a strong bullish pressure as soon as the 50 EMA moves above the 200 SMA.
Let’s look at the different steps on how to trade the 50 & 200 EMA golden cross:
- Wait for the price to aim higher by creating a higher high to define the overall price context as bullish.
- Identify the 50 EMA below the 200 SMA and wait for a crossover.
- Wait for the crossover candle to close above the two moving averages, and enter the buy trade on the next candle.
- The stop loss should be below the 50 EMA. The logic behind the stop loss is to consider the trade valid as long as short-term traders are holding the price above the 50 EMA.
- The primary stop loss would be based on 1:1 risk/reward, where you should take some profit and move the stop loss at break even.
- Later on, the final take profit level would be based on 1:2 risk/reward ratio or near-term resistance level.
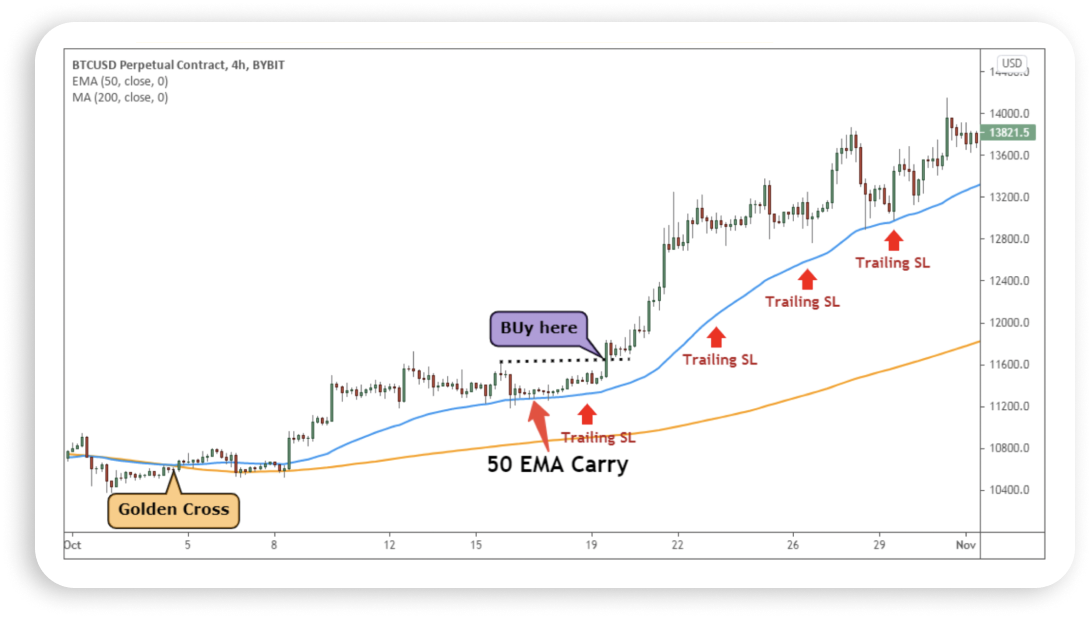
Golden Cross with 50 EMA Carry
In strong trending markets, after the crossover, the price should not break below the 50 EMA. In this case, we look for the price to find support at the 50-period EMA, which is going to stop the price from dropping further. If the bullish pressure is strong, the price might move along with the 50 EMA instead of moving below it. It is often tricky to find out whether the 50 EMA will hold the price or not. This is why this strategy is not best suited for new traders, who may lack trading discipline. Still, if at least two bearish rejection candles appear at the 50 EMA level, we may consider it a carry.
As you can see on the chart below, the golden cross appears and the price becomes corrective immediately afterward. Instead of moving down below the 50 EMA, it starts to stall at the 50 EMA area.
Let’s look at the different steps on how to trade the golden cross with 50 EMA carry:
- First, wait for the golden cross pattern and identify a corrective market. Notice that there is a strong bullish movement following the EMA crossover, which points to a high-probability trade.
- Wait for the price to stall at the 50 EMA. Two consecutive and successful retests of the 50 EMA can often be an indicator for a bullish reversal.
- After the 50 EMA carry, wait for a bullish candle to break above the most recent swing high.
- Enter the trade at the close of the bullish candle.
- The stop loss should be below the 50 EMA with some buffer, and the take profit should be based on trailing the stop loss below the 50 EMA.
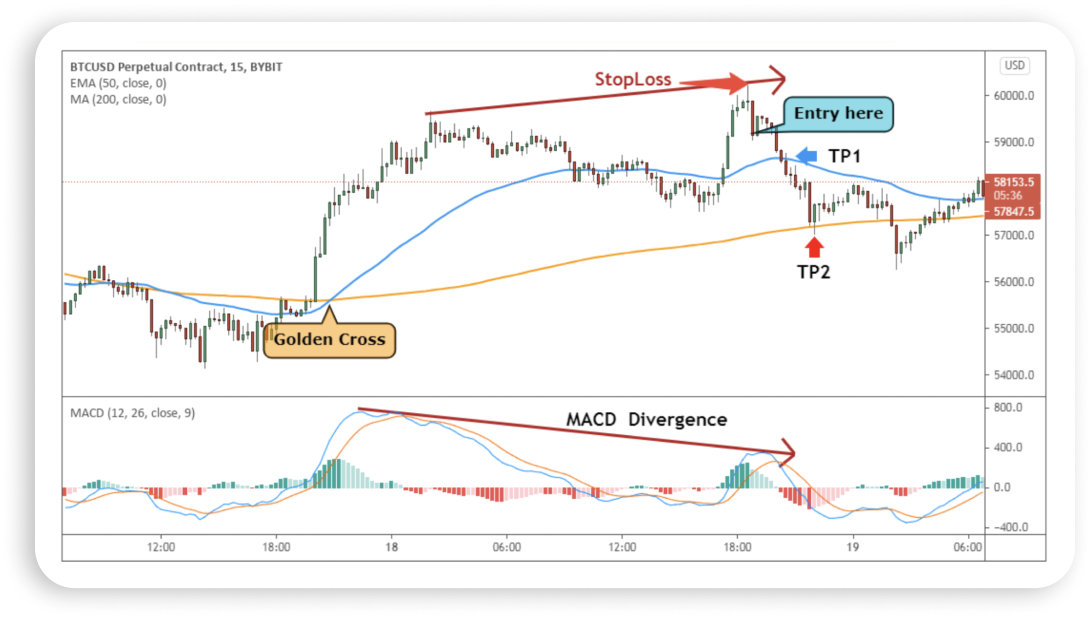
Mean Reversion Trading Strategy
Now it’s time to dive into the third trading strategy. In the financial market, there are both buyers and sellers at every price level. So, even if the price were to move higher after the golden cross, there is a possibility of bearish movement.
There is a strong gravitational attraction between the price and the 50-period’s exponential moving average. When the gap between the price and 50 EMA expands, they start to come closer.
As a general rule, the bigger the gap between the price and the 50 EMA, the bigger the profit potential is. Now, how can you benefit from it?
In this strategy, we need a sharp movement after the golden cross, and the entry point is further validated by the MACD indicator.
In the chart example below, you can see how the price moves lower after forming a divergence with the MACD. The gap between the price and the 50 EMA extends at the entry point. As a result, the price reverts back to its average.
Let’s look at the different steps on how to trade the golden cross with mean reversion trading strategy:
- Wait for the golden cross and identify the price above the 200 SMA and 50 EMA.
- The price should be further away from the 50 EMA.
- Find the potential regular divergence with the MACD, and wait for a bearish candle to close.
- Enter the trade after the candle closes and set the stop loss above the swing high, with some buffer.
- The first take profit is 50 EMA, and the final take profit will be 200 SMA.
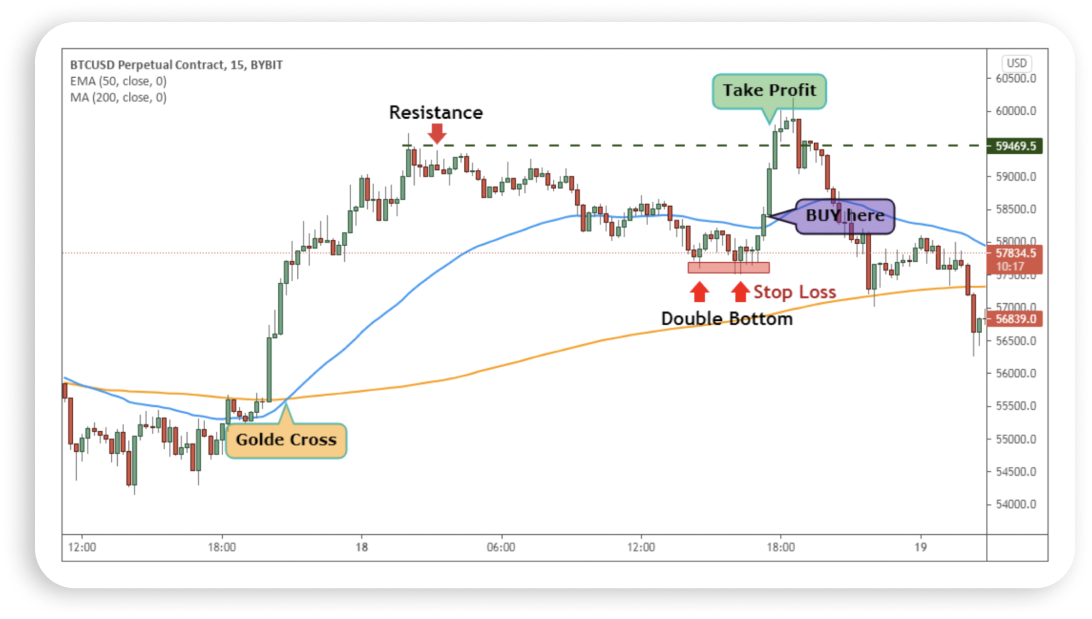
A Golden Cross with Double Bottom Pattern
We have already touched on three trading strategies using the golden cross, and now we will look at the fourth and last one. Making trades based solely on the crossover might not be suitable every time. So what if a golden cross happens, but the price moves downward? You might think it’s a false crossover signal, but that is not necessarily the case.
If you don’t want to miss those trades, the golden cross with a double bottom pattern strategy is for you.
A double bottom is an area where the price makes two equal lows. It indicates that sellers tried to take the price down, but bulls became active at this level to take the price higher.
Here is an example of a double bottom pattern.
Let’s look at the different steps on how to trade the golden cross with a double bottom pattern:
- Wait for a golden cross to happen with an impulsive, bullish pressure.
- The price should come down below the 50 EMA but above the 200 SMA, with a corrective speed.
- Identify the double bottom pattern and wait for a candle to close with a new high to confirm the pattern.
- Enter the trade as soon as a new bullish candle appears with a higher high.
- The stop loss should be below the low of the double bottom pattern with some buffer.
- The first take profit will be based on a 1:1 risk/reward ratio, where you should close 50% of the trade and move the stop loss at break even.
- Lastly, you can hold the trade as long as possible, but taking total profit at the near-term resistance level would be the best idea.
Limitation of the Golden Cross Pattern
All indicators are lagging, and no indicator can truly predict the future. Many times, an observed golden cross produces a false signal. Despite its apparent predictive power in forecasting prior large bull markets, golden crosses also do regularly fail to manifest. Therefore, a golden cross should always be confirmed with other signals and indicators before placing a trade.
The key to using the golden cross correctly, with additional filters and indicators, is to always use a proper risk management strategy while trading to prevent any unexpected market movements. Remembering to always keep to a favorable risk-to-reward ratio and to time your trade properly can lead to better results than just following the cross blindly. It is even essential in order to become a successful and profitable trader in the long term, independently of the strategy you choose to follow.
You will certainly have understood by now where the attention toward the golden cross pattern comes from. Despite its relatively uncertain outcome, when used in addition to well-known trading indicators like the relative strength index (RSI) or moving average convergence divergence (MACD), it appears to be a pretty reliable indicator of a trend’s direction. After reading this article, you also know how to differentiate it from its twin brother, the death cross, and have become familiar with four different trading strategies using the golden cross pattern. As long as you stay disciplined, following your strategy and mindfully placing your stop losses in accordance with your risk management plan, you should be successful trading with the golden cross.


