


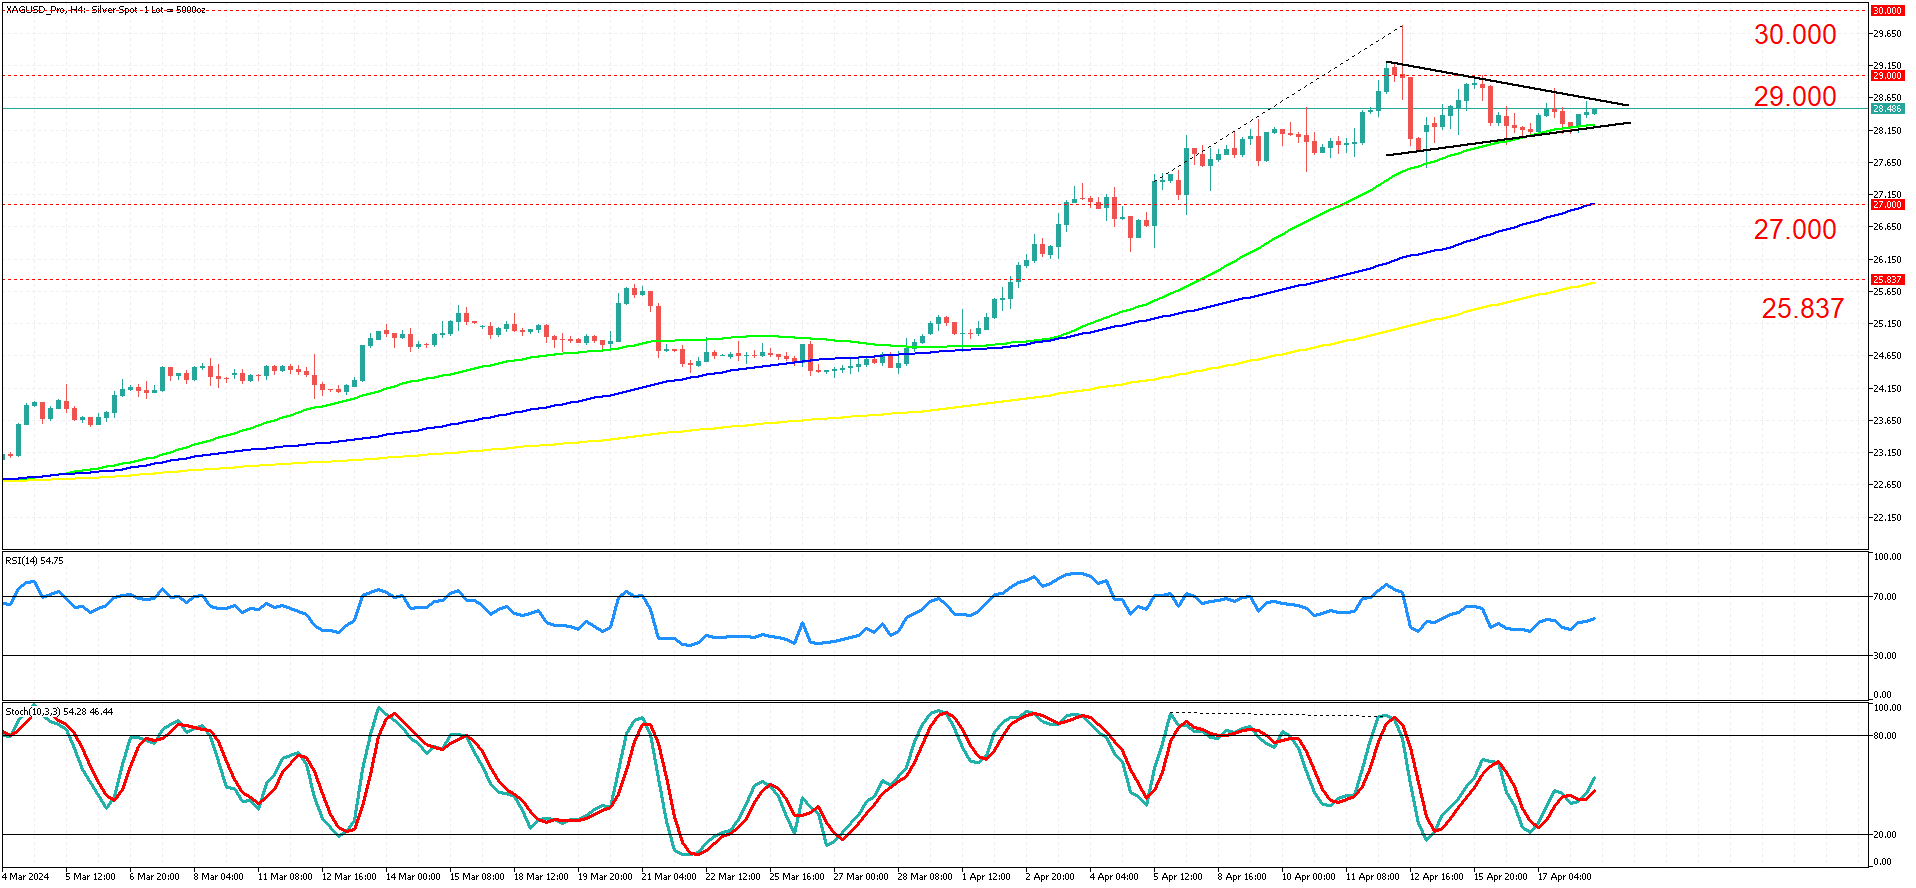
XAGUSD on the 4-hour timeframe had been moving in a range until a breakout occurred on the 4th of March. Since then, the bulls have been unstoppable, pushing prices to highs last seen in 2020 and 2021.
The bulls, however, failed to break through the formidable resistance level of 30.000 and lost momentum just a few pips short of it. This bearish exhaustion was indicated by a shooting star candlestick pattern that formed at the psychological level of 29.000, as well as a strong bearish divergence between the price action and the stochastic oscillator.
After a period of higher volatility, the market entered a sideways movement accompanied by a triangle pattern, which could lead to a strong potential breakout.
Although the moving averages suggest that the long-term trend should be upwards, the significant resistance level at 30.000 cannot be ignored. Therefore, we anticipate at least a short-term pullback before any further attempts to test or break the 30.000 level.
If the market breaks out of the triangle towards the downside with conviction, then we can focus on the 27.000 level or the 100-period simple moving average (depicted in blue).
In case the momentum continues, we can even aim for the 25.837 support level or the 200-period simple moving average in yellow.
If the price breaks out of the triangle to the upside, it is possible to target the level of 30.000. However, this increase in price might be a bull trap, a scenario where a break to the upside deceives many investors into buying. Soon after, the price falls sharply as there is an improvement in liquidity.
It is important to closely monitor market sentiment, particularly in response to tensions in the Middle East, as it can impact the risk appetite of investors, fueling a risk-on or risk-off move in the markets.
Summary:
- Silver has been trading in a strong uptrend.
- A bearish divergence has formed in the market.
- Currently, the market is consolidating within a triangle formation.
- This consolidation suggests the potential for a significant breakout.
- The short-term bias indicates a downward movement.
- Price targets for the downside are set at 27.00 and 25.837.
- Alternatively, a breakout to the upside is possible.
- Caution is advised for a potential bull trap in case of an upside breakout.
- If an upside breakout occurs, the next target area is around 30.000.


