
The Nasdaq ($NAS100) is a stock index that tracks the performance of the 100 largest non-financial companies listed on the NASDAQ stock exchange. The index includes companies from a variety of sectors, including healthcare, consumer discretionary, consumer staples, telecommunications, utilities, industrials, and technology.
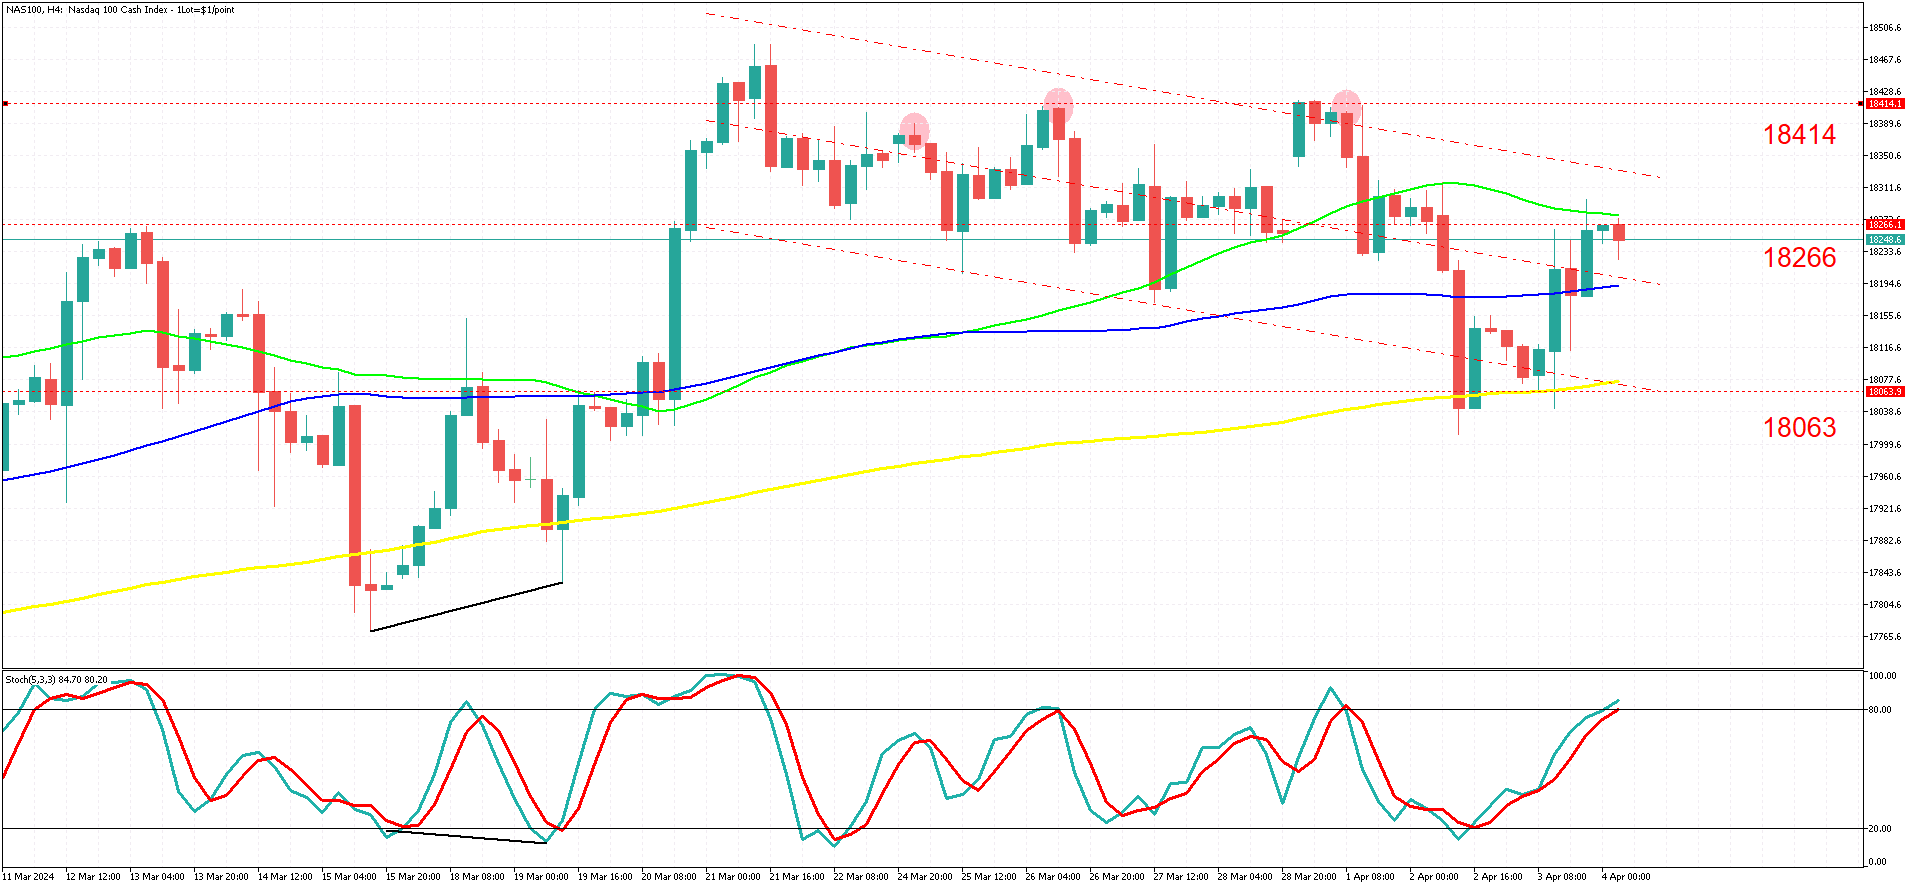
In a 4-hour timeframe, the Nasdaq showed a downward trend until a bullish divergence formed on March 19th. From that point, the market made a strong upward push, reaching a new high of 18483 on March 21st.
This high at 18483 marked the last bullish move before a decline started. The decline is currently contained within a downward-sloping channel, and we are trading above the 200-period simple moving average (in yellow). This suggests the long-term move should continue higher. However, we have seen a couple of lower highs and lower lows, indicating the possibility of a continued short-term move to the downside.
During downtrends with lower volatility, there are potentially favorable risk-reward opportunities near the upper band of the channel. As shown in the graph, whenever the stochastic oscillator's signal line and main line intersect while the price is close to the upper line of the downward-sloping channel, the odds generally favor a short-term decline. These intersections are depicted in pink circles.
Currently, the market is trading at the upper end of the channel, and the stochastic oscillator indicates an overbought condition (above 80). Additionally, the resistance level at 18266 was tested and rejected. This suggests a potential short-term continuation to the downside, with targets at the 18063 support level or the 200-period simple moving average.
This downtrend will likely continue as long as the 18414 high remains intact and there are no significant shifts in market sentiment. The setup remains valid as long as the price stays within the channel.
Alternatively, if the market breaks above the 18414 level, we can anticipate higher highs, with 18483 being the first target.
It is important to keep track of the market drivers and sentiments. If these remain unchanged, then the short-term target would be the 200-period SMA or the 18063 level.
Summary:
- The $NAS100 is approaching the upper band within a downward-sloping channel.
- The stochastic oscillator is indicating overbought conditions, poised for a main line crossover.
- The recent touch of the 18266 resistance level resulted in rejection.
- This implies a short-term bearish bias, targeting the 200-period SMA or the 18063 support level if we remain below 18414.
- Alternatively, a breach above 18414 would negate the bearish outlook, with 18483 as our next target.