Global stocks rebounded after the Fed confirmed the amount of borrowing from the Discount Window eased after the liquidity crisis. The Discount Window is an emergency fund the central bank makes available to banks to assist with short-term liquidity. The borrowing hit a new high after multiple banks such as SVB, signature bank, and Credit Suisse collapsed. Borrowing from the fund is now at 700 million, which is still seven times higher than traditional levels.
The above is improving investor sentiment, shown within the pricing of global assets. However, investors will now focus on the US’s employment figures. So far this week, the US has released six major economic data related to the economy and employment. All six indicate a downturn but not necessarily a recession just yet. The main concern for investors is the ISM Manufacturing and Services PMI and OPEC’s decision to lower production targets.
The price of Crude Oil has remained at $80 per barrel as OPEC cleverly changed its tactics to price the commodity at profitable levels. Crude oil inventories were again in the minus this week for the second time in 2 weeks, supporting oil prices. However, oil prices will only be able to maintain higher prices while the economy avoids a recession.
NASDAQ - Global Stocks Bounce Back
This afternoon's employment figures will mainly influence the NASDAQ throughout the day. Markets expect the US Non-Farm Payroll change to read 228,000, much lower than the previous two months but still considerably higher than traditional levels. Investors expect the Unemployment Rate to remain at 3.6%. If the NFP is higher than expected and the Unemployment Rate does not rise, investors will expect the economy to maintain positive growth for the stock market. However, positive employment news will also support inflation and prompt the central bank to increase interest rates again, which harms the stock market.
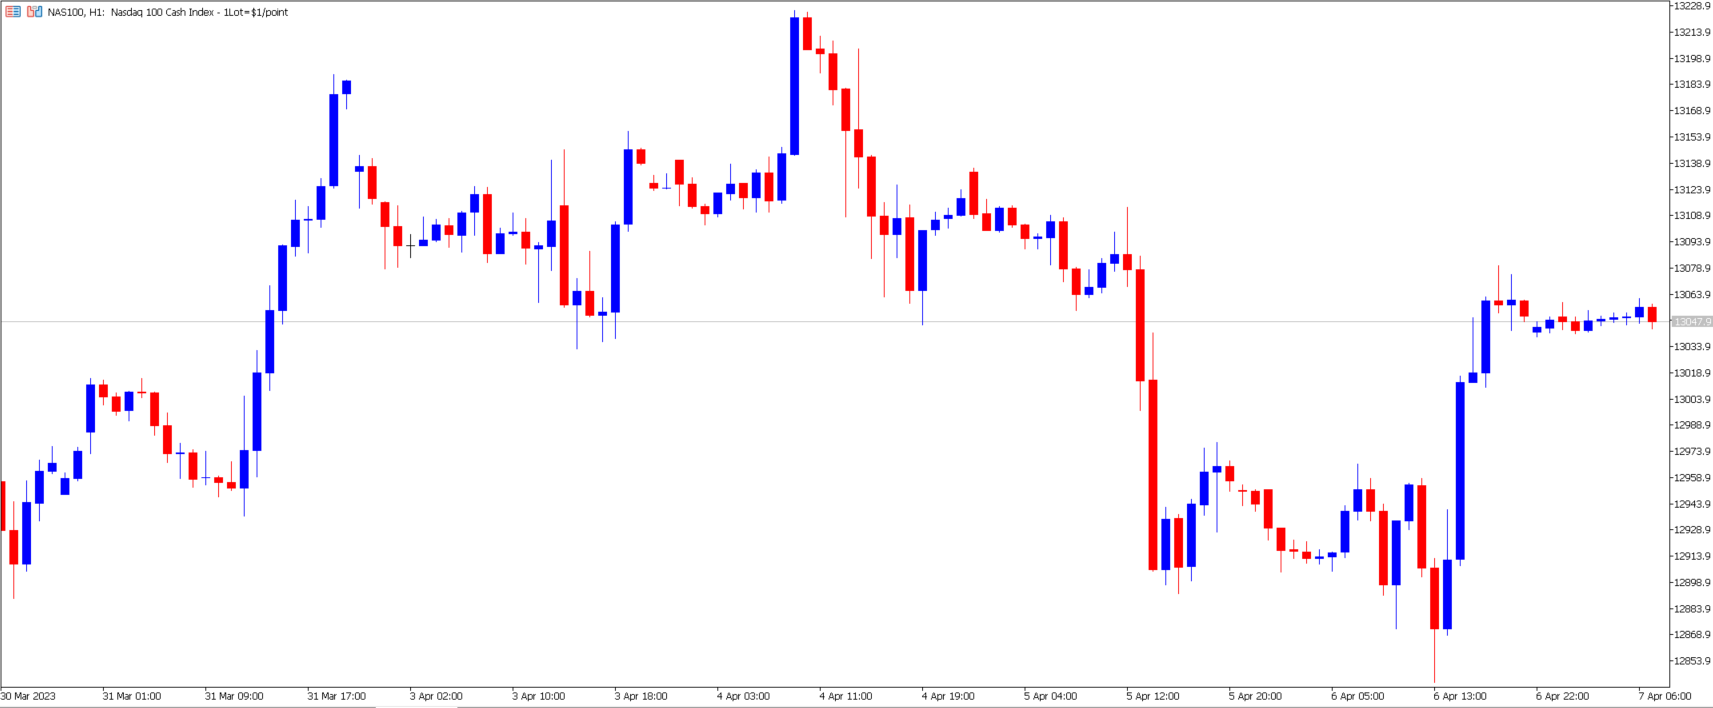
The price of the NASDAQ ended the day with a moderate climb measuring 0.74%. A 0.74% climb may not seem significant, but if we measure the rebound after the opening of the US trading session, the bullish price movement measured 1.69%. However, the NASDAQ's price movement indicates that the trend can swing in either direction.
The medium to longer-term price movement continues to form a bullish trend and point upwards. The decline from earlier this week simply began the traditional retracement taking the price to the previous support level. However, in the shorter term, the upward price movement from this morning brings the instrument to the current resistance levels. Therefore traders should be cautious of how today’s event may trigger price movements and the direction of the trend.
As mentioned above, in the short term, investors will be influenced by the employment figures, but next week’s inflation data is deemed even more influential. The Consumer Price Index is scheduled to be released on Wednesday, and the Producer Price Index on Thursday. Investors are hoping the inflation rate will show a significant decline. However, the data will not yet include the higher energy prices, which are not likely to show until June’s announcement.
Currently, investors are pricing in an interest rate no higher than 5.25%; however, if the Federal Open Market Committee decides to increase it to 5.5%, the pricing of the NASDAQ is likely to change. FOMC Member Fed President Bullard is currently pushing a rate of 5.5%. In addition to the monetary policy, investors will pay close attention to the Quarterly Earning Reports starting mid-April. The performance of the US largest companies will significantly impact the NASDAQ, but also, to a lesser extent, the Dollar and Gold.
XAU/USD - Investors Focus on US NFP Data
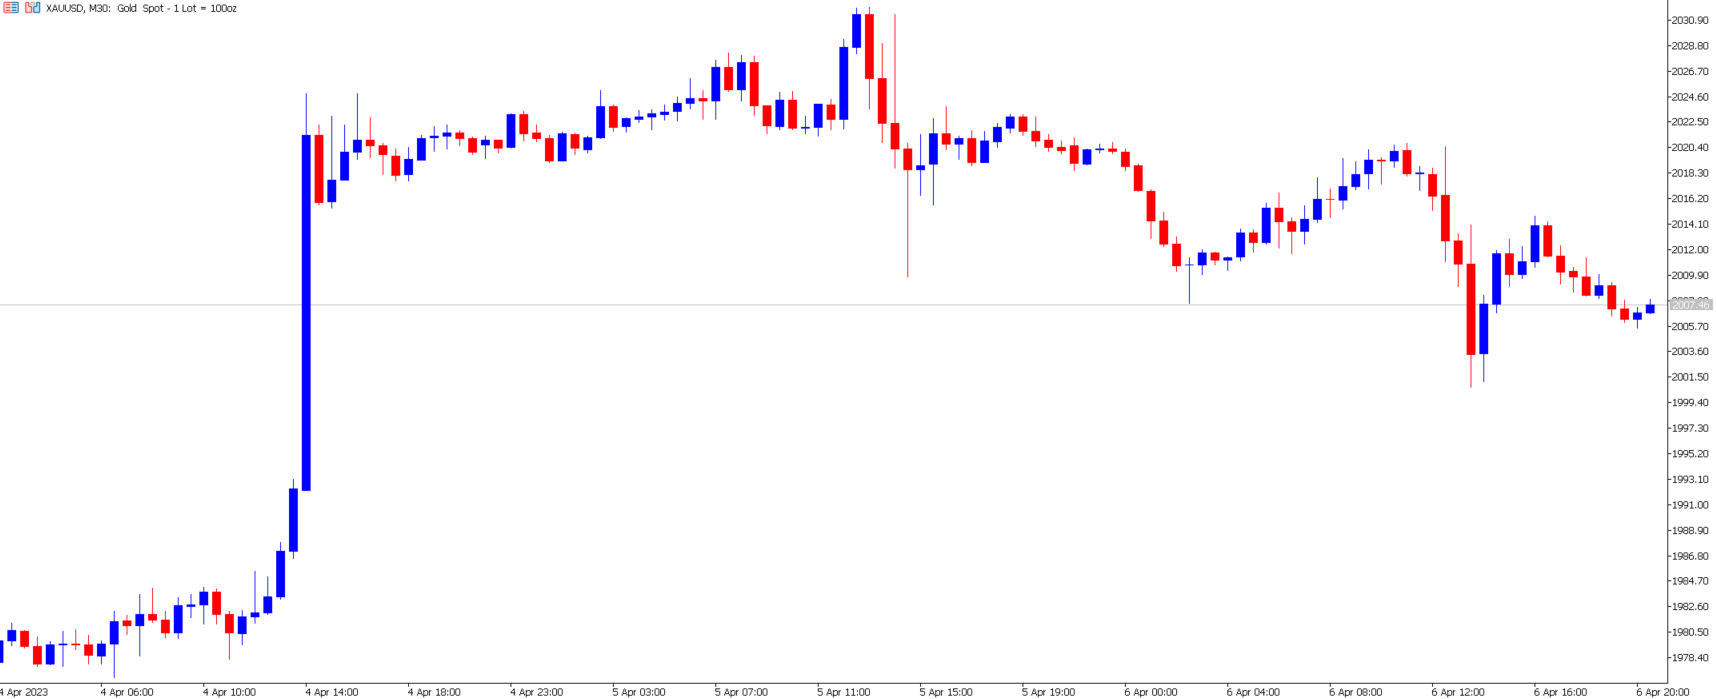
Gold's price declined slightly over the past two trading days as investor sentiment improved somewhat. However, the cost of Gold is also strongly correlated with the US Dollar. The US Dollar Index has declined below 102.00. Therefore, traders should be cautious that a bullish price movement is still possible while the Dollar is falling.
Investors should also note that Gold is correlated with the stock market but to a lesser extent than the Dollar. The high price of Gold indicates that many institutional investors are preparing for poor economic performance and a weaker Dollar. Investors are also preparing for the negative effect, which higher inflation, high-interest rates, and a weaker Dollar may bring about. Therefore, Gold is also used to hedge against inflation and adverse economic conditions.
Investors should note that the price movement of Gold, Bonds, and the US Dollar can also assist with the potential price movement of the NASDAQ and stocks.
Summary:
- Global stocks rebounded after the Fed confirmed the amount of borrowing from the Discount Window eased after the liquidity crisis.
- Investor sentiment slightly improved, but investors are uncertain whether sentiment will continue to improve after this afternoon’s employment data.
- The US Non-Farm Payroll changed to 228,000, much lower than the previous two months but still considerably higher than traditional levels.
- The employment figures will determine the NASDAQ’s price, next week’s inflation data, company earnings, and whether the Fed indicates a 5.25% or 5.50% fund rate.
- Gold slightly declines as investor sentiment rises, though the Dollar weakens.