


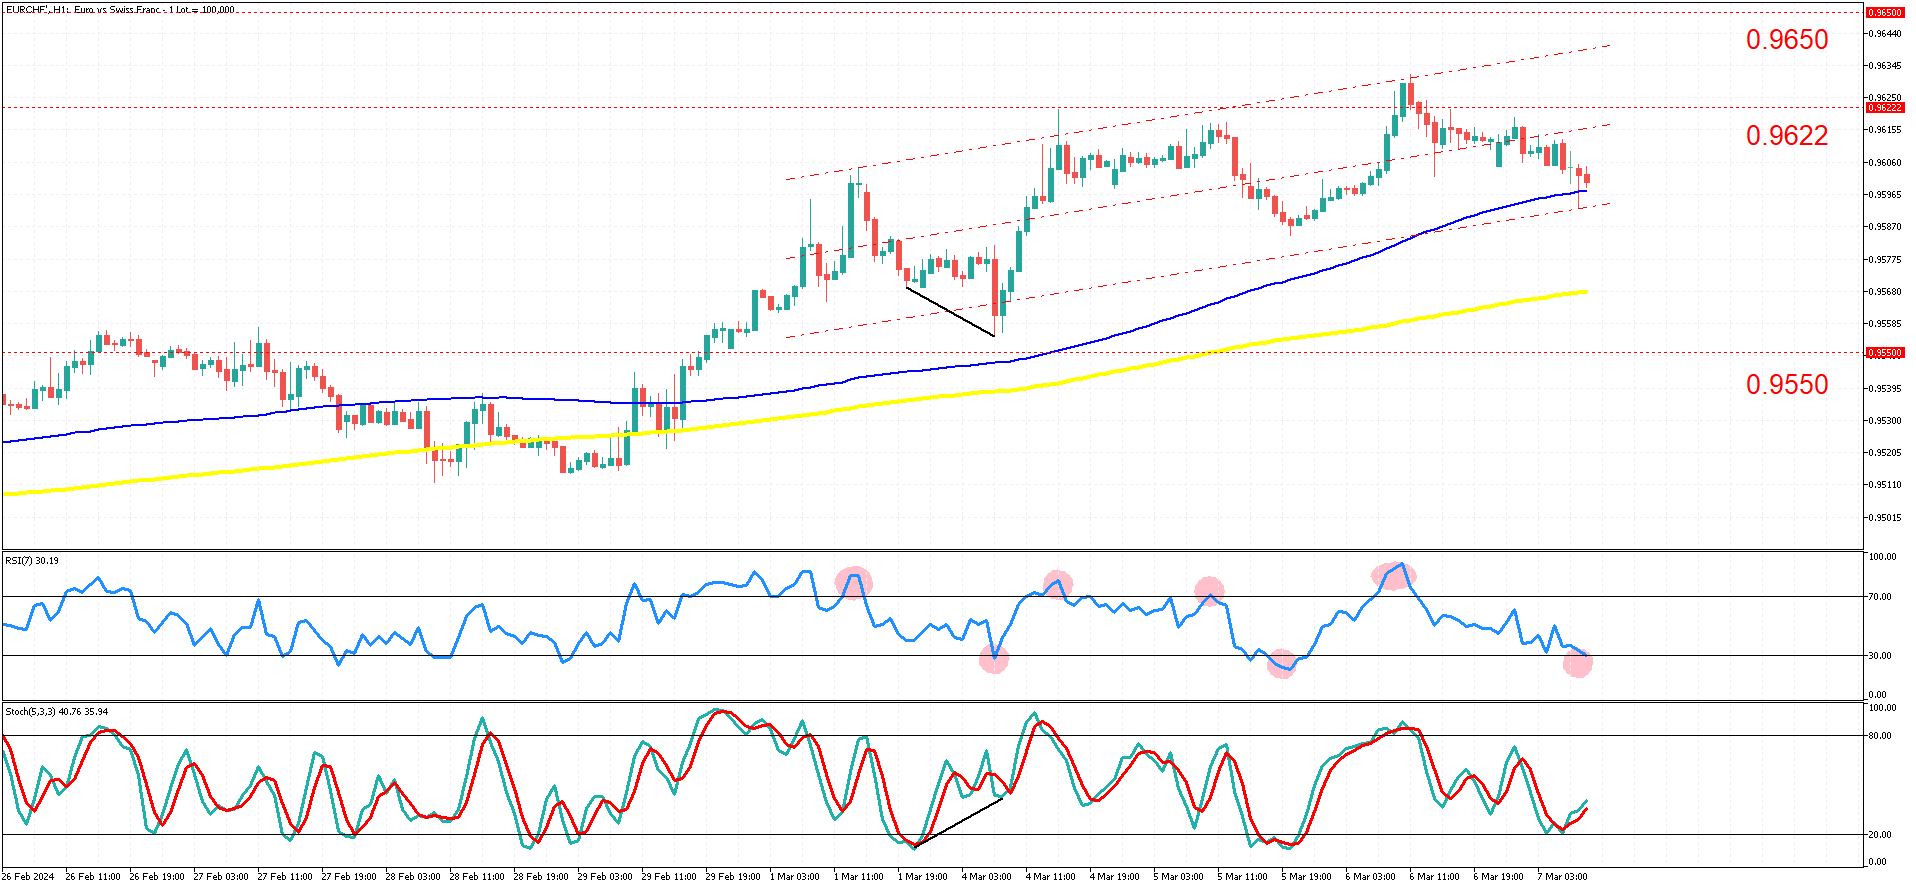
EUR/CHF 1-Hour Timeframe, 07 March 2024
The EUR/CHF has been steadily climbing with low volatility since January 31st, 2024, on a 1-hour timeframe.
Since the beginning of March, the EUR/CHF has been trading within a steady upward sloping channel. The start of this channel also displayed a classic divergence signal before another upward push. Divergence occurs when the stochastic oscillator and price move out of sync. In this case, while the price was making lower lows, the stochastic oscillator was plotting higher lows.
Examining the indicators can provide insight into where the market might be headed next.
Both the 100 and 200-period simple moving averages indicate an upward trend and are positioned below the price, suggesting strong support for the bulls. The 100-period simple moving average, shown in blue, has historically served as a reliable dynamic support and resistance level for this pair.
A hammer candlestick pattern has appeared on our 100-period SMA, which reinforces our moving average analysis. While the candlestick pattern alone may not carry significant weight, its presence on a dependable moving average adds credibility. Thus, we can infer that the bulls have gained further momentum for a potential upward move.
A closer examination of our regression channel reveals an upward trend. In such cases, an optimal entry point would be when the price reaches the bottom band of an upward-sloping channel. To confirm this, we can utilize the RSI indicator.
It's worth noting that whenever the price dips into the lower half of the channel, accompanied by an oversold RSI level, we tend to see an upward movement. While not foolproof, this setup has proven to be fairly reliable in reducing downside risk and increasing upside potential within the prevailing trend.
Considering all these factors, there appears to be a strong indication of an upward trend. The moving averages, price channel, candlestick pattern, price action, and RSI all point towards a potential upward movement in the market.
Depending on your risk tolerance, you may consider taking profits at various levels such as the center or top of the channel, or at resistance levels of 0.9622 or 0.9655.
It's possible that there may be a slight price decrease. During upward trends, markets often experience deeper retracements. It wouldn't be unexpected if the market retraces back to the area between the 100 and 200-period simple moving averages, coinciding with the 38.2% and 50% Fibonacci retracement levels.
As long as market sentiment remains positive and the price stays above the 0.9550 level, the market will likely maintain a bullish bias. Keep an eye out for any shifts in sentiment or decisive breaks below previous lows.
Summary:
- The EUR/CHF has been following a low volatility uptrend since January 31st, 2024.
- A robust upward-sloping regression channel has formed in the market.
- Currently, a hammer candlestick pattern has emerged on the 100-period SMA at the lower boundary of the channel, indicating a potential upward movement.
- This signal is reinforced by an oversold RSI, coupled with the price positioned above the 200-period SMA.
- Conservative targets include the centerline and top line of the channel.
- Further targets lie at resistance levels of 0.9622 and 0.9650.
- Close monitoring of sentiment and the 0.9550 level is crucial, as they could invalidate bullish scenarios.


