


EUR/AUD 4-Hour Timeframe, 18 January 2024
The EUR/AUD in the 4-hour timeframe has been steadily trending downwards with low volatility until it reached its lowest point on January 2, 2024. Since then, the market has shifted to a gradual, low-volatility uptrend.
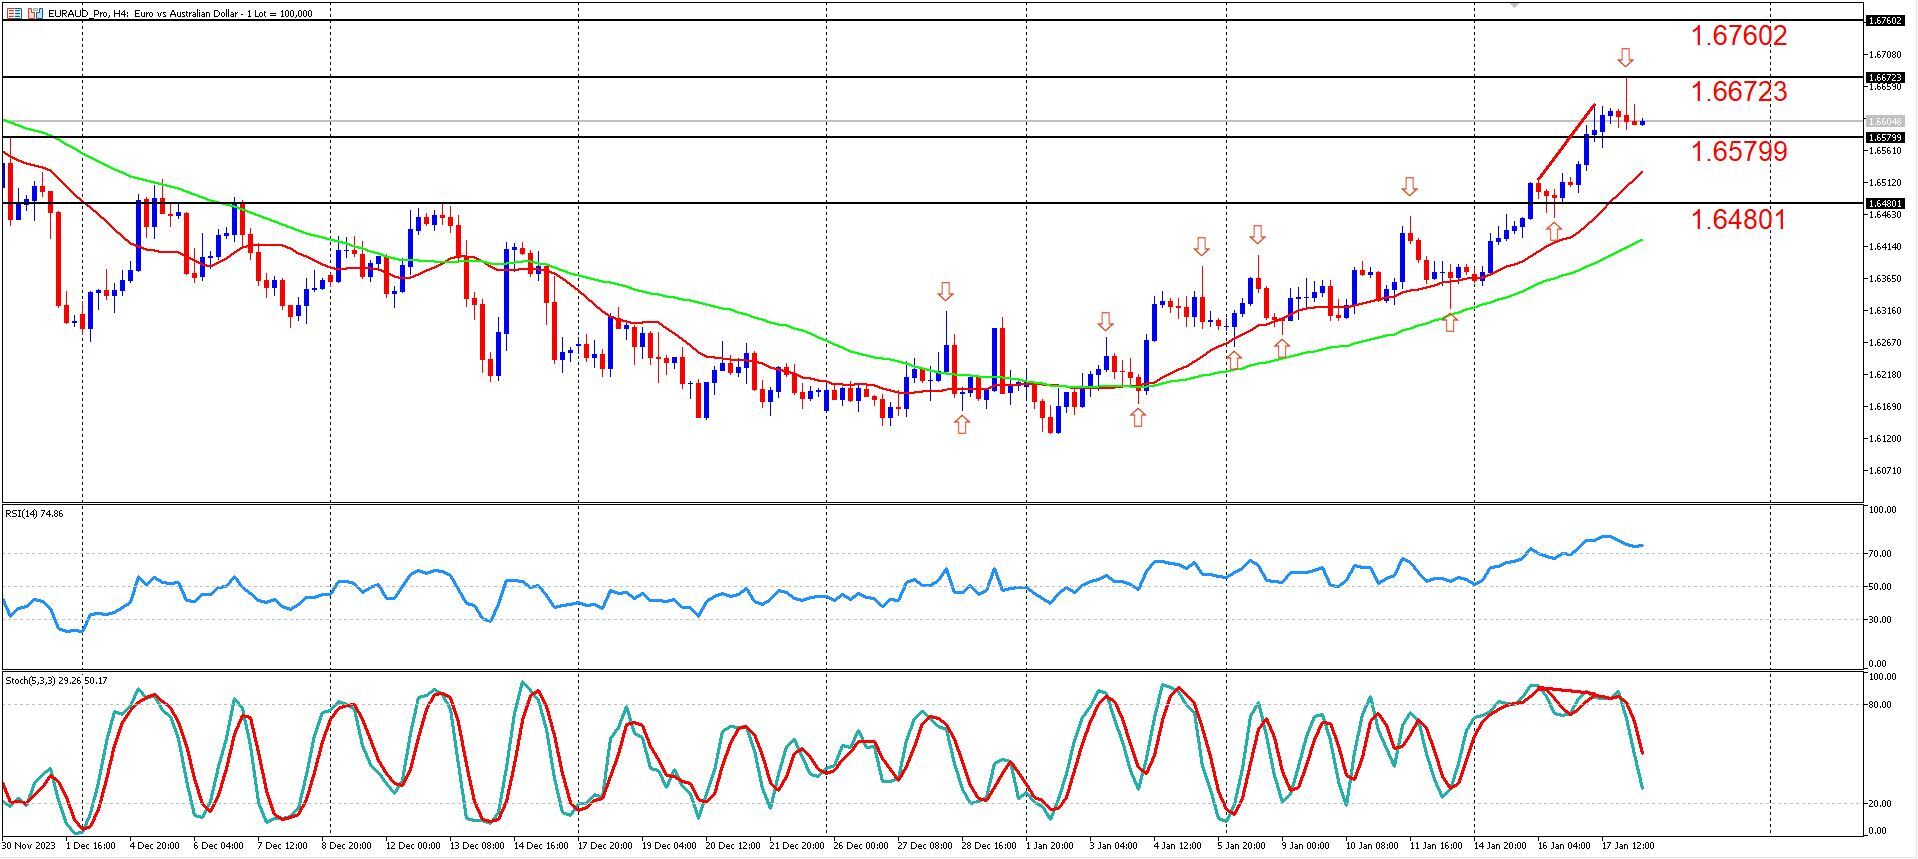
On the price chart, there's a 50-period simple moving average (SMA) in lime and a 20-period SMA in red. It's crucial to understand how these levels act as dynamic support and resistance during both uptrends and downtrends. The market often reverses its direction when it enters the area between these two SMAs.
Looking at the moving averages and the longer-term trends, there seems to be an upward bias. However, the markets are complex and require more in-depth analysis. There are several key support and resistance levels at 1.67602, 1.66723, 1.65799, and 1.64801. Recently, the market has reached and reversed from the 1.66723 resistance level.
The manner in which the market reversed at the 1.66723 level is significant. It formed a distinct Shooting Star candlestick pattern, which appeared right after a divergence was noted. Past instances of shooting star or hammer patterns on the chart serve as respected technical indicators. The divergence is evident as the price made higher highs, while the stochastic oscillator made lower highs, a strong indicator of potential reversal.
These three indicators — the shooting star pattern at the resistance level coupled with divergence — suggest a short-term bearish bias.
Currently, the market is in an accumulation phase, trading sideways without a clear direction. Depending on how the market responds to the support and resistance levels, different strategies might be considered. If the market breaks below the recent support level at 1.65799, it could be a potential short setup, targeting 1.64801 or the zone between the 50 and 20-period SMAs. The short-term outlook remains bearish.
On the other hand, if the market closes above the recent high at 1.66723 convincingly, it might negate the short-term bearish trend, and long trades aiming for 1.67602 could be considered. It's important to stay alert for major fundamental changes, as breakouts from such ranges, particularly after a period of low volatility, can lead to significant market moves.
Summary:
- EUR/AUD is currently in an uptrend, confirmed by the moving averages.
- The short-term bias is to the downside due to the respected shooting star candlestick at the 1.66723 level, shortly after the bearish divergence formed.
- If the market can break below the recent low of 1.65799, this can trigger a potential bear run towards the 1.64801 and even the 50-period simple moving average.
- However, if the market closes above the recent high with conviction, the next target for bulls might be 1.67602.
- Due to lower volatility in the past few days, a breakout of the abovementioned levels might initiate a very strong and volatile move.


