


Past performance is not indicative of future results. All historical data, including but not limited to returns, volatility, and other performance metrics, should not be construed as a guarantee of future performance.
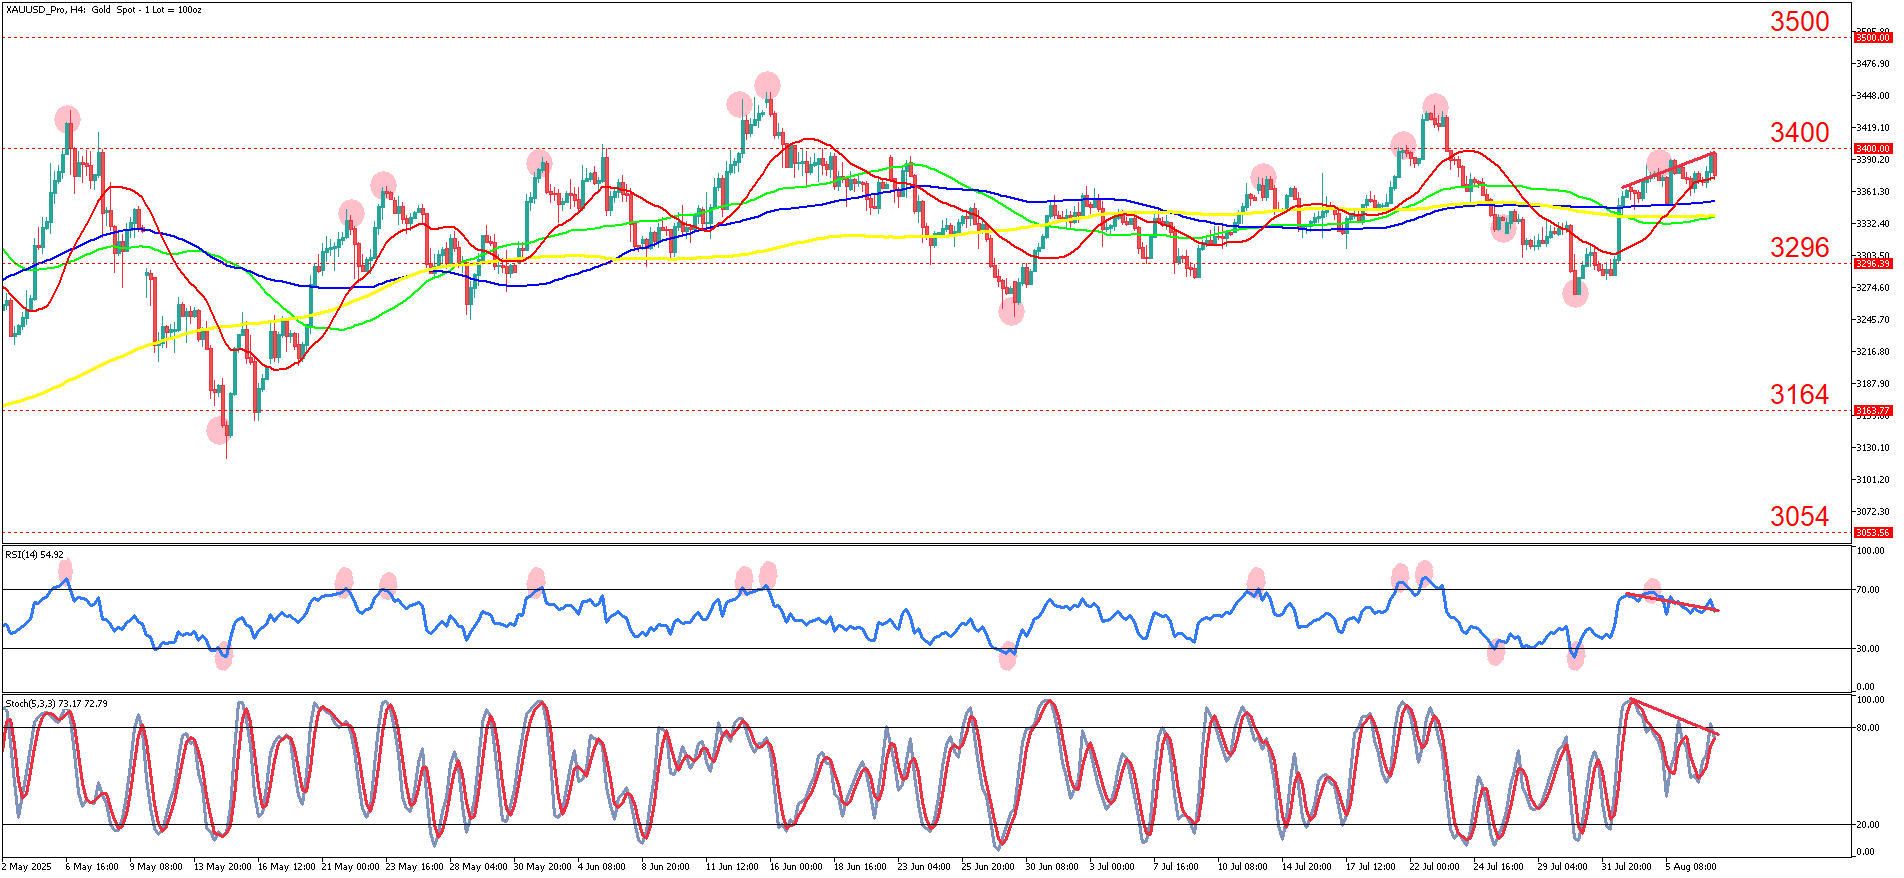
XAUUSD on a 4-hour timeframe.
Historically, gold has demonstrated consistent mean-reverting behavior, particularly evident in its oscillations between the key horizontal levels of 3054, 3164, 3296, 3400, and 3500. Throughout May and June, price oscillated within a wide range, with repeated rejections at resistance near 3400 and support around 3296. The asset has shown a textbook tendency to revert to its mean after significant directional moves, reinforcing gold's characteristic behavior as a range-bound instrument in the absence of dominant macroeconomic drivers.
In recent sessions, gold rallied sharply from the late-July low near 3296 and is now consolidating just beneath the 3400 resistance level. However, this upward movement has occurred within an ascending wedge formation, which typically suggests potential bearish resolution. Despite price making a series of marginal higher highs, momentum has not confirmed the move, and the rally appears to be losing steam. This reflects a broader context of mean reversion, where impulsive rallies are met with corrective pullbacks, lacking follow-through beyond established range highs.
A critical technical observation is the clear and developing bearish divergence between price action and momentum indicators. While price action has made successive higher highs approaching 3400, both the Relative Strength Index (RSI) and the Stochastic Oscillator have posted lower highs. This classic bearish divergence signals underlying weakness in the current rally and suggests that buyers are losing control even as price continues to climb. RSI sits at 54 and is declining, while Stochastic is hovering near overbought territory with a distinct downturn—both hinting at exhaustion and a possible reversal.
The primary scenario favors a breakdown from the current rising wedge structure. A rejection at 3400, combined with sustained divergence, could lead to a retracement back to the 3296 level. If that level fails to hold, the next logical support lies at 3164 and then 3054. This view is reinforced by the converging and flattening moving averages (50, 100, and 200-period), which emphasize the absence of strong directional momentum and favor a reversion to equilibrium.
The alternative scenario would require gold to decisively break and hold above 3400, invalidating the divergence through a strong continuation of bullish momentum—evidenced by RSI pushing above 70 and a breakout in the Stochastic Oscillator. In that case, the next upside target would be the 3500 resistance area. However, without a fundamental driver, such a move is less probable given recent price behavior.
Fundamentally, gold has faced mixed signals in the past few days. Stronger-than-expected U.S. ISM Services PMI data added pressure on gold through firmer rate expectations and higher yields, but this was partially offset by geopolitical tensions and continued weakness out of China, which preserved gold's safe-haven demand.
SUMMARY:
- Gold is stuck in a range between 3054 and 3400, showing classic mean-reversion without strong catalysts.
- The recent rally from 3296 hit resistance at 3400 and formed a rising wedge—often a bearish warning.
- Bearish divergence on RSI and Stochastic signals fading momentum despite higher highs in price.
- Breakdown below 3400 looks likely, targeting 3296 first, then 3164 and 3054 if support cracks.