


NASDAQ 100 on a 4-Hour Timeframe
Past performance is not indicative of future results. All historical data, including but not limited to returns, volatility, and other performance metrics, should not be construed as a guarantee of future performance
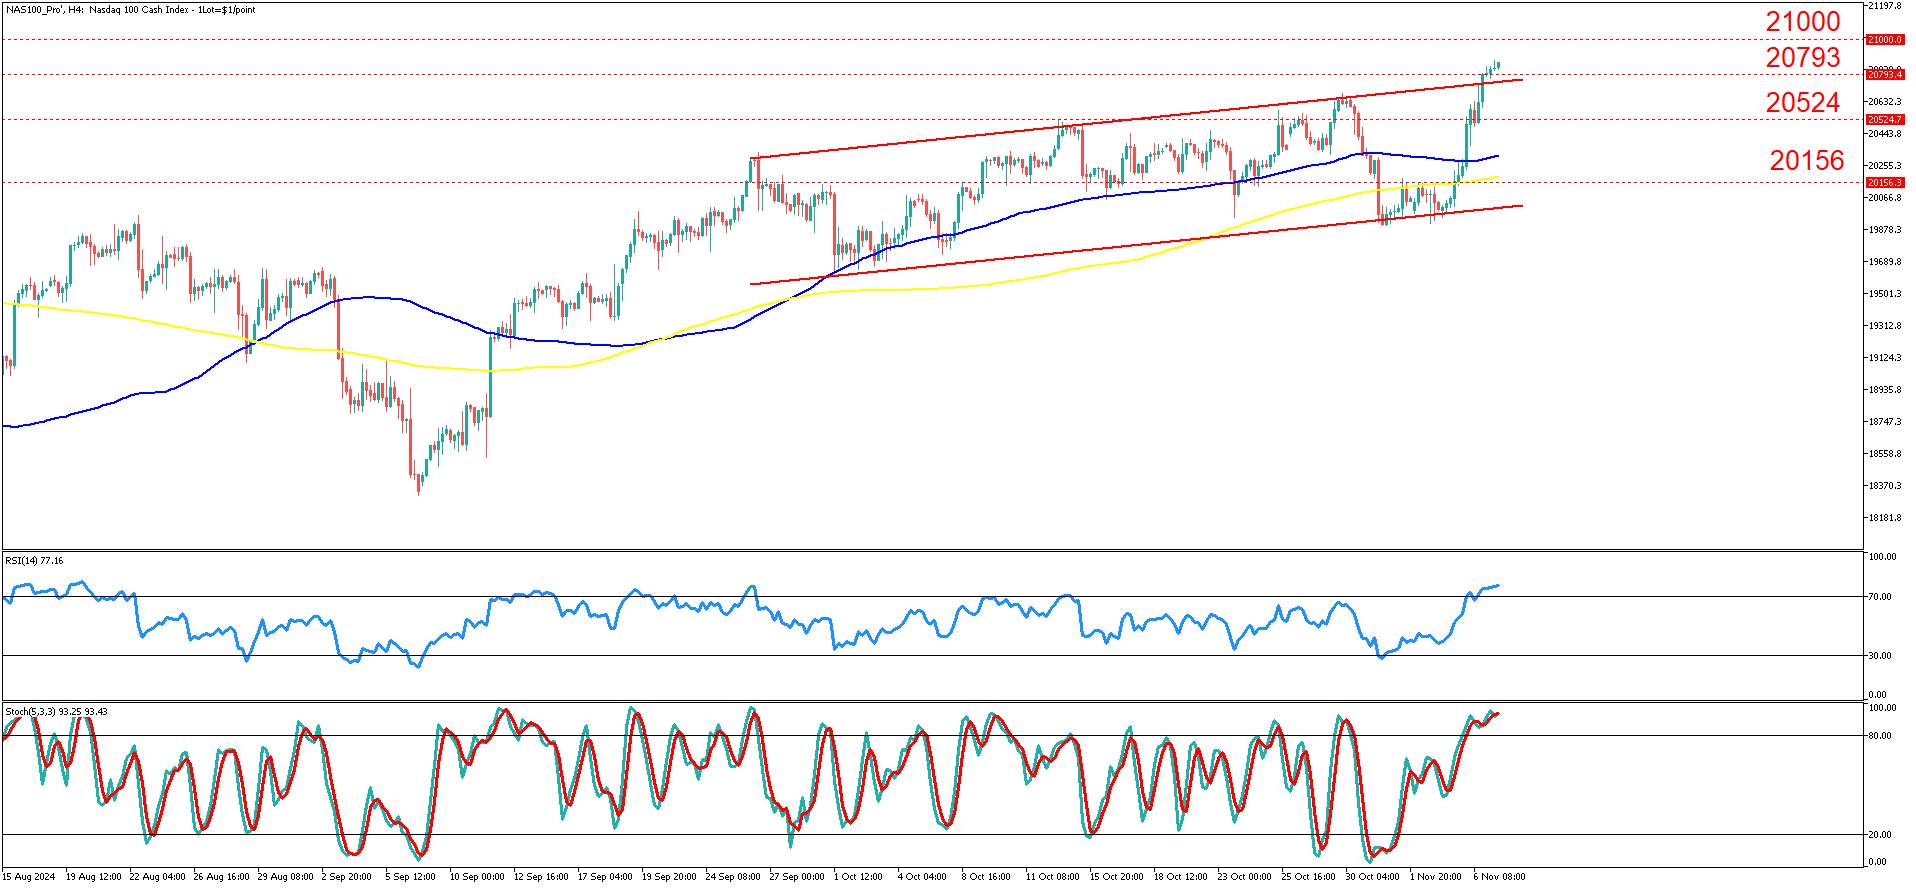
NASDAQ 100 on a 4-hour timeframe shows a steady upward trend within an ascending channel that has been in place since early October. The price action has recently approached the upper boundary of this channel, indicating a test of resistance around the 20793 mark. This movement follows a steady climb, with the price trending above both the 100-period and 200-period moving averages, which are sloping upwards and suggest continued bullish momentum over this timeframe.
In the most recent price action, the NASDAQ 100 exhibited a breakout attempt, pushing above a previous resistance near 20,524. The Relative Strength Index (RSI) currently reads at 77, placing it in overbought territory, which signals caution for potential short-term pullbacks. Meanwhile, the Stochastic Oscillator also registers a high value above 90, reinforcing the possibility of an upcoming corrective move given the strong upward pressure and limited immediate support below.
Both the RSI and Stochastic readings point toward an overbought market, suggesting that while the bullish trend is intact, it may be nearing exhaustion at these levels. The price remains significantly above the 100-period and 200-period moving averages, affirming the underlying bullish trend but also highlighting the gap that might attract profit-taking from shorter-term traders. The next support level below sits near 21,000.
In the primary scenario, the NASDAQ 100 may continue its bullish trend, breaking decisively above 20,793 to aim for the next resistance level near 21,000. Sustained movement above this level would indicate the strength of buyers, potentially leading to a continuation of the bullish trend toward 21,200 in the near term. This scenario relies on ongoing positive market sentiment and supportive technical conditions, particularly if key economic data, such as non-farm productivity or consumer sentiment, positively influence risk appetite.
An alternative scenario involves a rejection at the 21,000 resistance level, which could trigger a pullback toward the 20,524 level and, in a deeper retracement, toward the lower boundary of the ascending channel near 20,156. This scenario would likely materialize if economic data increases concerns about inflation or a weakening labor market, prompting investors to seek safer assets and reducing buying interest in tech-heavy indices like the NASDAQ 100.
Investors should exercise caution as the overbought technical readings on both the RSI and Stochastic suggest a potentially limited upside in the short term, with heightened volatility possible around key resistance levels. Additionally, fundamental factors like the latest U.S. elections, labor market report and rising inflation pressures from the Core PCE index could add to uncertainty, especially if upcoming economic data indicates challenges for growth and sustains inflationary concerns, impacting Federal Reserve policy expectations.
Summary:
- NASDAQ 100 tests resistance at 20,793 amid bullish trend.
- Overbought RSI signals potential for short-term pullbacks.
- Stochastic Oscillator also indicates overbought conditions.
- Key support level below at 20,524 for potential retracement.
- Positive economic data could fuel further gains.
- Break above 21,000 may signal continuation toward 21,200.


