


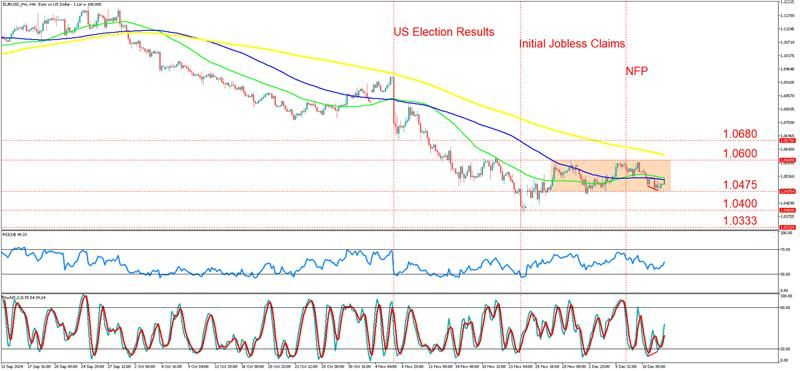
EURUSD on a 4-Hour Timeframe.
The pair has exhibited a clear bearish trend since late September, as seen by the price consistently trading below the 50-period (green), 100-period (blue), and 200-period (yellow) moving averages. This persistent downward movement was driven by a strong US dollar, reinforced by macroeconomic events such as the US Election Results, Initial Jobless Claims, and the Non-Farm Payrolls (NFP) report, which influenced market sentiment. During this period, the pair registered a significant decline from above 1.1100 to the recent lows near 1.0333.
In recent price action, the $EURUSD has entered a consolidation phase, forming a trading range between 1.0475 and 1.0600, as marked by the yellow-shaded rectangle. The pair has tested the upper and lower boundaries of this range multiple times without a definitive breakout. The current price action shows $EURUSD hovering near the lower part of the range at 1.0475. This range-bound movement suggests that market participants are awaiting a significant catalyst to drive the next directional move.
Technical indicators suggest a mixed picture. The Relative Strength Index (RSI) hovers around 49, indicating a neutral sentiment. The stochastic oscillator, however, shows signs of divergence, with the indicator making higher lows while the price remains flat or makes lower lows. This bullish divergence hints at a potential reversal or an upside breakout if market conditions support it. Despite this, the downward pressure remains evident, particularly as the pair remains below key moving averages, reinforcing the broader bearish outlook.
The main scenario projects that if the $EURUSD breaks above the 1.0600 resistance level, it could open the way for further gains towards 1.0680, particularly if supported by dovish statements from the European Central Bank (ECB) or weaker-than-expected US data. This potential breakout would be significant, as it would mark a move above the 100-period moving average, potentially reversing the current short-term trend.
Alternatively, a failure to hold above the 1.0475 support could lead to further declines towards 1.0400 and potentially down to 1.0333. If the ECB adopts a hawkish stance or the US dollar continues to strengthen due to robust economic data, this bearish scenario becomes more likely. In such a case, $EURUSD could resume its longer-term downtrend.
Investors should exercise caution, as an ECB rate decision is scheduled for later today. This event is likely to introduce heightened volatility and may trigger a breakout from the current trading range. Any surprises in the ECB's monetary policy stance or commentary on inflation and economic outlook could significantly influence the $EURUSD pair's direction. Monitoring key support and resistance levels and staying updated on the ECB's statements will be critical for managing risk in the current environment.
Summary:
- EURUSD consolidates between 1.0475 and 1.0600, signaling indecision in the market.
- RSI remains neutral at 49, while stochastic divergence suggests potential upside.
- Resistance at 1.0600; a breakout could lead to gains towards 1.0680.
- Support at 1.0475; a breach could extend losses to 1.0333.
- The upcoming ECB decision and US economic data are key catalysts for EURUSD's next directional move.