1. Home
  2. Markets Updates
  3. EUR/USD Breaks Out: Analyzing New Channel & Trading Signals

EUR/USD Breaks Out: Analyzing New Channel & Trading Signals

EUR/USD's recent breakout leads to a new consolidation phase with an upward channel

Updated October 5, 2025

Share the article:

EURUSD_ProM30_01_Aug_2024.png

Past performance is not indicative of future results. All historical data, including but not limited to returns, volatility, and other performance metrics, should not be construed as a guarantee of future performance. 

EURUSD on a 30-minute timeframe 


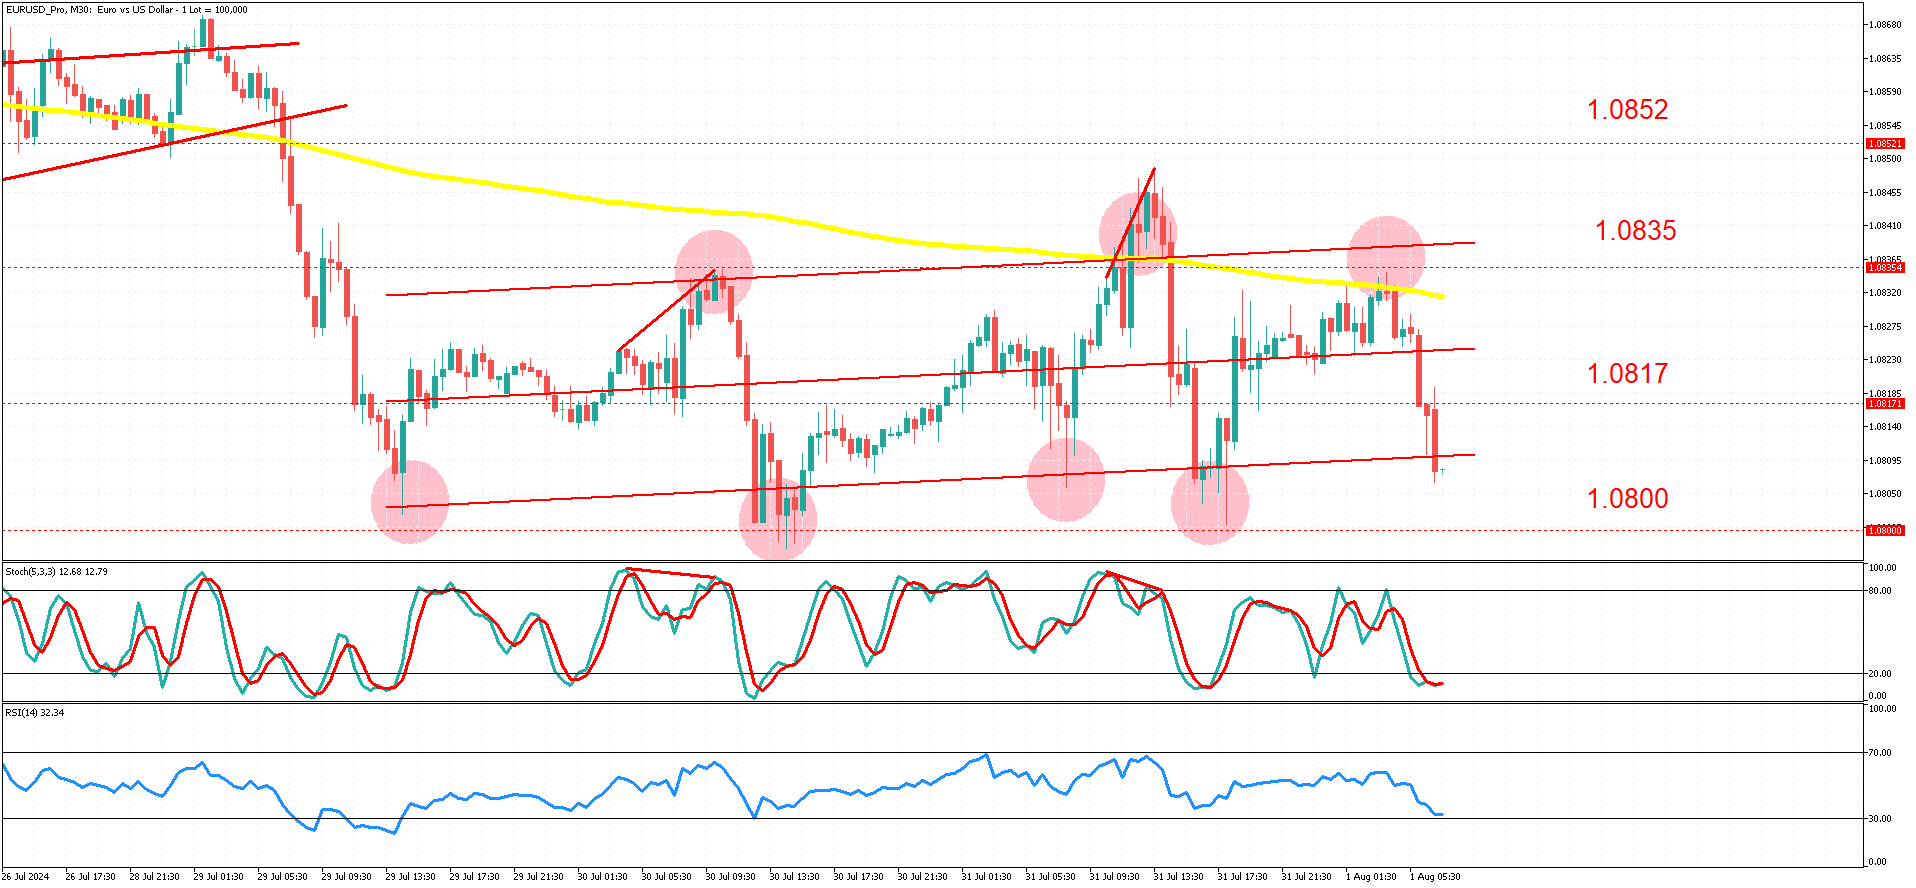
The EUR/USD on a 30-minute timeframe has been trading in a triangle pattern with reduced volatility. On July 29, we saw a well-anticipated and strong breakout, with the pair falling 50 pips without much hesitation. 

Following this, the market transitioned from a trending phase to a consolidation phase, trading within a contained range. We now have an upward-sloping regression channel with well-respected boundaries, as indicated by the red circles on the chart. 

From a technical perspective, we are looking for extremes coupled with oscillator confirmation. Price action behaviour is evident when we reach the top or bottom trendline of the channel, and when the stochastic oscillator's main and signal lines cross. If the stochastic is in overbought or oversold territory, it further strengthens the signal. 

Since our channel is upward-sloping, potential buy trades are more favorable than sell trades, as the short-term trend appears to be rising. However, considering the longer-term trend indicated by the 200-period simple moving average, the overall trend seems to be downward. 

The current potential technical setup favours a mean reversion scenario, where price trades back to the mean. In this case, the mean or potential targets could be the centre line of the channel, the 200-period SMA, or even the opposite trendline of the channel. 

Alternatively, if price action breaks below the bottom trendline with conviction, we might see a retest of the 1.08 level. This is a strong psychological barrier and has experienced numerous retests in the past few weeks. 

However, keep an eye on upcoming fundamentals and investor sentiment. 

Summary 

  • EUR/USD broke out of the triangle pattern, falling 50 pips. 
  • The market has transitioned into a consolidation phase within an upward-sloping channel. 
  • Technical signals from oscillators are indicating potential reversals and key levels. 
  • Prices may revert to the channel's center line or the 200-period SMA. 
  • A break below the channel's bottom trendline could test the 1.08 level. 
  • Upcoming economic data and shifts in investor sentiment should be monitored closely. 

     
IMPORTANT NOTICE: Any news, opinions, research, analyses, prices or other information contained in this article are provided as general market commentary and do not constitute investment advice. The market commentary has not been prepared in accordance with legal requirements designed to promote the independence of investment research, and therefore, it is not subject to any prohibition on dealing ahead of dissemination. Past performance is not an indication of possible future performance. Any action you take upon the information in this article is strictly at your own risk, and we will not be liable for any losses and damages in connection with the use of this article.
CFDs are complex instruments and come with a high risk of losing money rapidly due to leverage. of retail investor accounts lose money when trading CFDs with this provider. You should consider whether you understand how CFDs work and whether you can afford to take the high risk of losing your money.

Related articles

Top Economic Events to Watch | March 2 - 6, 2026
March 2, 2026
Discover the top economic events from 2-6 March that will move markets, including US ISM Manufacturing & Services PMI and the Big Friday Jobs Report.

Read more

Gladys Eguia

Gladys Eguia

NAGA Weekly Recap Feb 23 - 27, 2026
February 27, 2026
Weekly Market Recap: Optimism returns to Asia as inflation cools, while legal trouble looms for Elon Musk over his X acquisition. Plus, deep dives on the latest oil supply squeeze, FX volatility, and the Fed’s next move.

Read more

Gladys Eguia

Gladys Eguia

NAGA Weekly Recap February 2 - 6, 2026
February 6, 2026
Weekly market recap covering volatile equities, Bitcoin’s 30% drawdown, key FX moves, and rotations into commodities as macro data drives sentiment.

Read more

Gladys Eguia

Gladys Eguia

RISK WARNING: CFDs are complex instruments and come with a high risk of losing money rapidly due to leverage. 77.41% of retail investor accounts lose money when trading CFDs with this provider. You should consider whether you understand how CFDs work and whether you can afford to take the high risk of losing your money.