Past performance is not indicative of future results. All historical data, including but not limited to returns, volatility, and other performance metrics, should not be construed as a guarantee of future performance.
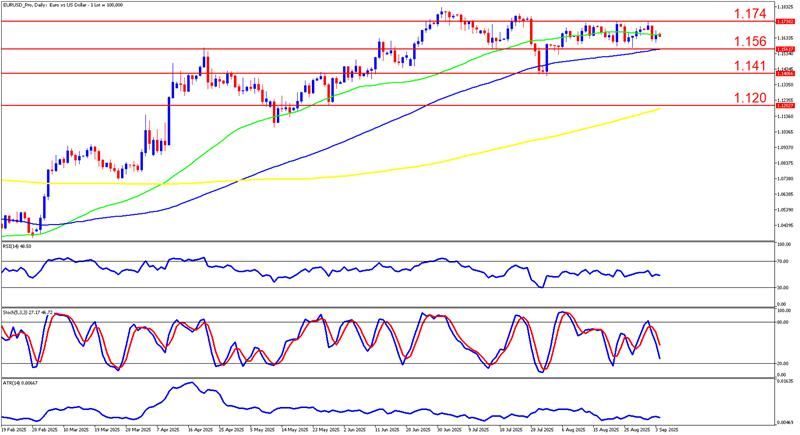
EURUSD on a daily timeframe
EURUSD on the daily timeframe shows that the pair has been in an extended uptrend since February 2025, with price climbing from the 1.08 region to highs above 1.18 in late June. The move was marked by strong bullish momentum, with higher highs and higher lows dominating until mid-July. However, since then the price has entered a consolidation phase, forming a sideways structure between the 1.156 and 1.174 levels.
In the most recent sessions, EURUSD has traded tightly within this consolidation band, with candles showing smaller bodies compared to the impulsive moves of earlier months. Attempts to break above 1.174 have been repeatedly rejected, while the downside has been cushioned by support at 1.156, which has held multiple times. Price currently sits closer to the midpoint of the consolidation, lacking directional conviction.
Indicators reflect this neutrality. The RSI is hovering around 48, showing equilibrium and the absence of momentum bias. Stochastics recently turned lower from overbought territory, suggesting short-term selling pressure. Moving averages remain supportive of the longer-term uptrend, with the 50-day above the 100-day and both well above the 200-day, but price is now pressing on the 100-day line. ATR continues to trend low, signaling suppressed volatility and a range-bound market.
The main scenario favors continued consolidation between 1.156 and 1.174 in the near term, as the market awaits a catalyst. A sustained break above 1.174 would likely trigger a fresh bullish leg, targeting the 1.1850–1.19 region, supported by the broader uptrend structure and moving average alignment.
Alternatively, if sellers manage to force a close below 1.156, a deeper retracement toward 1.141 could unfold, with the 200-day moving average near 1.120 acting as the ultimate downside target. This bearish scenario would gain traction if indicators continue to weaken and if the RSI breaks below the 40 threshold.
Over the past week, the euro area has shown signs of improved activity, with its composite PMI rising to 51.1—the strongest pace since May 2024—driven by resurgent domestic demand and new orders. Inflation edged higher in August, with headline HICP at 2.1 % and core inflation steady at 2.3 %, reinforcing expectations that the ECB will hold its key rate at 2 % in the weeks ahead. ECB board member Isabel Schnabel echoed this view, indicating that the current policy stance remains appropriate absent any deterioration in inflation expectations. Meanwhile in the U.S., the July ISM Services PMI softened to 50.1, suggesting a cool in the services sector. Looking forward, the September 11 ECB rate decision and upcoming U.S. labor market and ISM services data—including jobless claims and ADP figures—represent key potential catalysts for the EUR/USD pair.
SUMMARY:
- Strong Uptrend Paused: EUR/USD rallies from 1.08 to 1.18, now stuck in 1.156–1.174 range.
- Neutral Technicals: RSI ~48, low ATR, moving averages still bullish — momentum on hold.
- Key Levels to Watch: Break 1.174 → 1.185–1.19; drop below 1.156 → 1.141, 200-day MA at 1.120.
- Catalysts Ahead: ECB stance steady, Euro PMI up; upcoming U.S. labor & ISM data could move the pair.


