


In forex, you can trade in both trending and range-bound markets. Range trading allows traders to buy at a market’s low and sell at its peak.
As we explore the complexities of range trading, we’ll delve into the indicators, volume dynamics, and strategies that shape this active approach. Discover how to navigate trading ranges and capitalize on opportunities in the market’s fluctuations.
How to Start Range Trading: A Quick Guide
You have two options for beginning range trading, depending on your confidence and experience level:
- Open a Live Account: Quickly and easily open a live account with Naga.com to start trading in real market conditions.
- Practice with a Demo Account: Test your range trading strategies risk-free in a demo account with Naga.com.
Alternatively, join the Naga Trading Academy to deepen your knowledge of range trading and explore other trading styles.
What is Range Trading?
Range trading is a trading strategy used when markets move within a defined price range, rather than trending upwards or downwards. Unlike trend-following strategies, which only capitalize on directional price movement, range trading allows traders to go both long and short depending on where the price is within the range. The price typically oscillates between a high resistance level and a low support level, forming a “ranging market,” where traders buy near support and sell near resistance to maximize potential profit. This horizontal price action can occur over various time frames, from short-term to long-term charts, and is often referred to as horizontal trading.

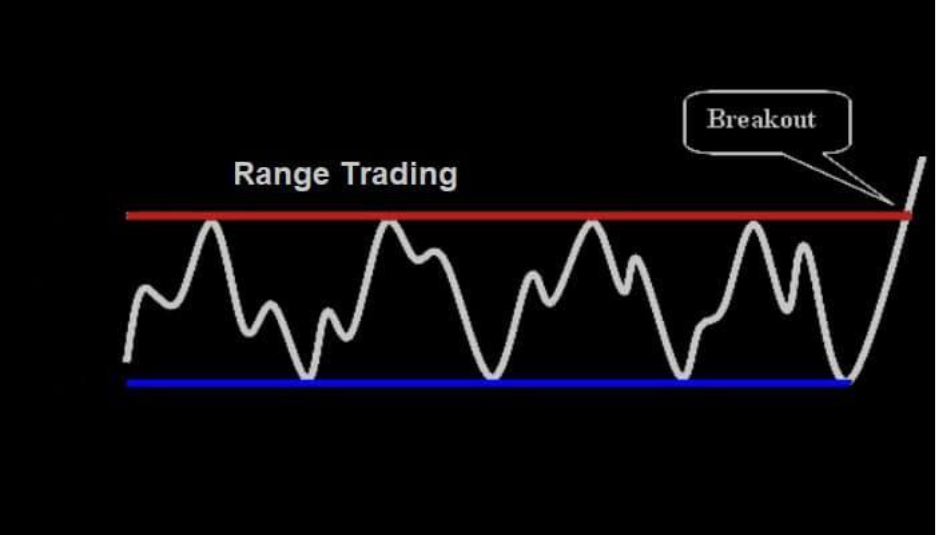
For illustrative purposes only
To identify entry and exit points, range traders employ technical indicators, support and resistance analysis, and volume patterns. Range trading capitalizes on price rebounds off established support and resistance levels, offering attractive risk/reward opportunities. However, range trading may not be effective in all market conditions, particularly when prices begin trending in a single direction due to increased volatility, which can signal the start of a new trend.
Types of Market Ranges
- Rectangular Range: A rectangular range forms when an asset’s price moves sideways and horizontally between defined support and resistance levels. This range helps traders identify potential buy and sell opportunities within high and low-price boundaries, making it one of the most commonly used range patterns.
- Constant Range: Constant ranges appear within an established market trend and include formations like pennants, wedges, triangles, and flags. These patterns suggest a potential breakout and act as corrections within the current trend. Traders may place trade orders against the trend during a constant range to take advantage of range-bound conditions.
- Diagonal Range: Diagonal ranges can be bullish or bearish, defined by upper and lower trend lines that signal potential market breakouts. As prices fluctuate, the range may expand or contract depending on the distance between high and low-price points. Wide gaps indicate an expanding range, while tighter gaps show contraction, presenting traders with ideal buying and selling opportunities.
- Irregular Range: Irregular ranges lack the consistent patterns of flags, diagonals, or rectangles but are marked by support and resistance levels around a central line. These ranges often arise from the combination of different range types, leading to an unpredictable market trend. Although challenging to navigate, traders can make trades based on emerging trends, with buy orders during projected uptrends and sell orders during anticipated downtrends.
What Range Traders Seek
Identifying a Trading Range: Range traders begin by identifying a trading range, typically when the price has tested similar high and low levels multiple times, forming consistent support and resistance. A range is generally considered more reliable with each additional touchpoint on these levels, giving traders confidence in the established boundaries. Setting Entry and Exit Points: Entry and exit points are strategically chosen based on support and resistance. Traders looking to go long may enter at support, anticipating a move back to resistance, while short sellers may enter at resistance, expecting a decline to support. Traders set their entry points near these levels and aim for the opposing boundary as the price moves within the range. Using Limit Orders: Limit orders are a common tool for range traders, as they allow for automatic entry once the price hits the desired level without needing constant market observation. This order type increases the likelihood of entering the trade at the targeted price, enabling traders to set their starting positions based on predetermined support and resistance levels. Monitoring for Breakouts: Since no range is permanent, traders closely monitor for potential breakouts—when the price moves beyond established support or resistance. To manage risk, stop-loss orders are often used, automatically closing the position if the price moves outside the expected range. Traders may also choose to close trades manually or shift to breakout strategies if the price exceeds support or resistance boundaries.
Range Trading vs. Trend Trading
Range trading and trend trading are two distinct strategies traders use to navigate financial markets, each tailored to different market conditions. Understanding the differences between these approaches is essential for spotting and capturing profitable opportunities effectively.
Range trading focuses on operating within a defined price range, capitalizing on fluctuations between support and resistance levels. Traders using this method look for markets or assets that consistently move within set boundaries, buying near support and selling near resistance to benefit from frequent price swings. Range trading is best suited for markets with sideways price movement and no clear directional trend.
In contrast, trend trading seeks to profit from sustained, directional price movements. Trend traders identify and follow a prevailing trend, typically entering positions aligned with the trend and holding until signs of a reversal appear. This strategy is ideal for markets with clear, sustained trends and aims to capitalize on longer-term price shifts.
Lear More About Trend Trading Strategies
Four of the Best Range Trading Indicators
Most range trading strategies rely on technical indicators that highlight overbought and oversold conditions, signaling potential shifts in market sentiment. These indicators are critical in helping traders determine entry and exit points and increase the likelihood of a profitable trade. Among the most commonly used indicators are pivot points, the Relative Strength Index (RSI), on-balance volume, and the average directional index (ADX). Each has unique features that enhance a trader's ability to navigate and capitalize on range-bound markets effectively.
Key Range Trading Indicators and Their Roles in Navigating Range-Bound Markets
Indicator Purpose Key Features Trader Usage Notes Pivot Points Identify support and resistance levels Calculates levels based on previous day’s price Find entry/exit points within the range Highly customizable; used with RSI for confirmation Relative Strength Index (RSI) Spot overbought/oversold conditions Scale 0-100; below 30 oversold, above 70 overbought Confirm potential reversals near range boundaries Best combined with other indicators to avoid false signals On-Balance Volume (OBV) Gauge volume strength within the range Tracks cumulative buying and selling volume Validates price moves and detects fake breakouts Volume often leads price; crucial for breakout confirmation Average Directional Index (ADX) Measure trend strength, identify range stability Scale 0-100; below 25 suggests weak/no trend Predicts stable range or breakout Used with other indicators to time breakouts effectively
Pivot Points
Pivot points are mathematical calculations based on the previous trading day’s high, low, and closing prices. These calculations project levels of support and resistance for the next trading day, offering traders potential reversal points within a range. Most trading platforms will plot seven lines automatically: a central pivot line (P), multiple support lines (S1, S2, etc.), and resistance lines (R1, R2, etc.). The basic principle behind pivot points is that they indicate possible exhaustion points, which can help traders time entries and exits. For instance, a trader might go long at the support level S1 and exit at the pivot or resistance level R1, or short at R1, aiming for S1 within the same trading range.
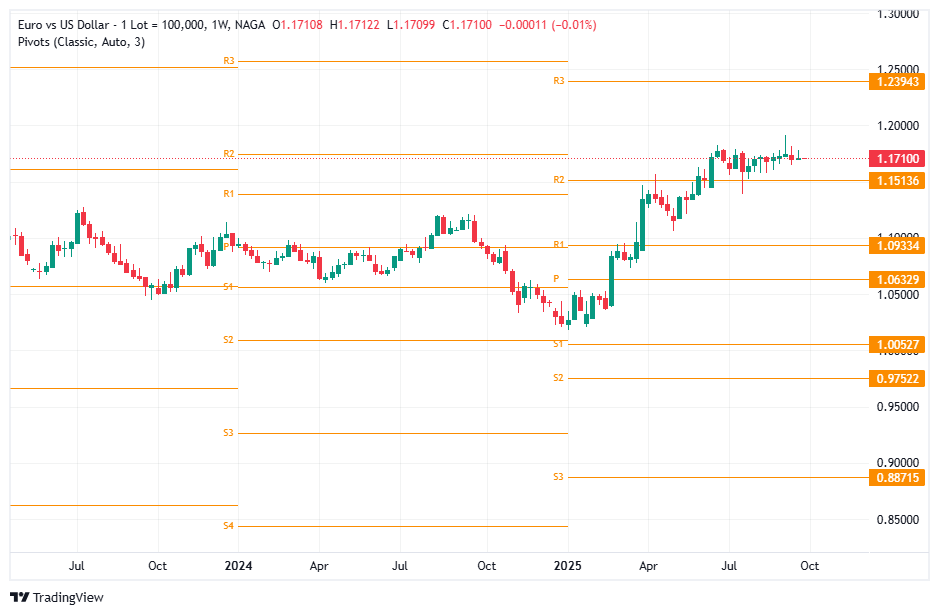
Past performance is not a reliable indicator of future results. All historical data, including but not limited to returns, volatility, and other performance metrics, should not be construed as a guarantee of future performance.
Pivot points are highly customizable and adaptable to different time frames, making them particularly versatile. By setting multiple layers of support and resistance, they offer a clearer structure within a range, increasing the chance of profitable trades. Many traders combine pivot points with other indicators like the RSI for added confirmation. When used effectively, pivot points not only reveal potential reversal levels but also help manage risk by allowing traders to place stop-loss orders just beyond these points.
What are Pivot Points and how to use in trading
Relative Strength Index (RSI)
The Relative Strength Index (RSI) is widely used in range trading to confirm overbought and oversold conditions within a range. Calculated on a scale of 0 to 100, RSI reflects a market's average gains versus average losses, helping traders spot potential reversal points. In a range-bound market, RSI values below 30 indicate oversold conditions, suggesting an upward reversal may be near, while values above 70 imply overbought conditions and a potential downward reversal. For range traders, an RSI reading that dips below 30 and starts to rise signals a potential support level, while a reading above 70 that begins to fall suggests the market may be hitting resistance.
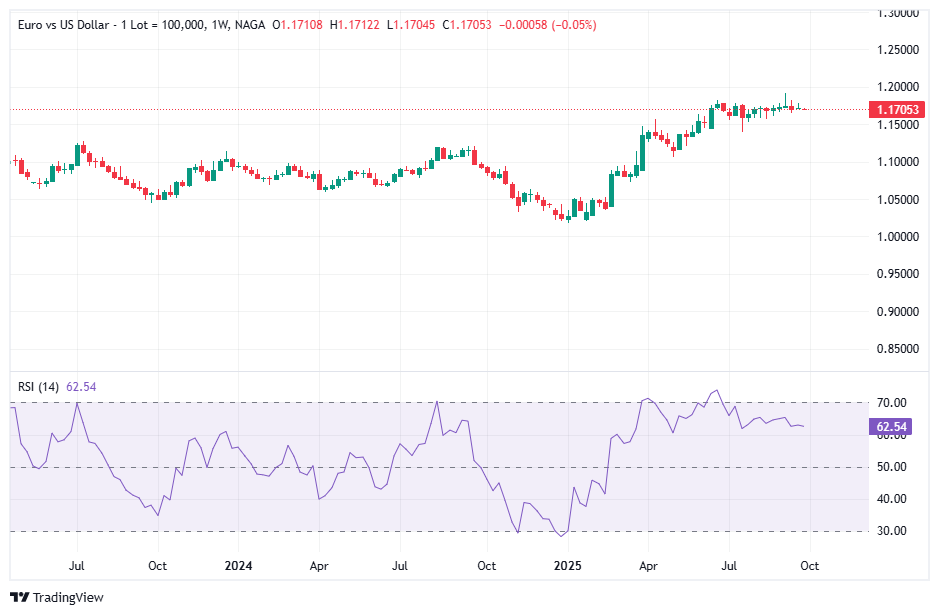
Past performance is not a reliable indicator of future results. All historical data, including but not limited to returns, volatility, and other performance metrics, should not be construed as a guarantee of future performance.
Using the RSI in tandem with pivot points enhances the clarity of these signals, giving traders a more comprehensive picture. Since markets can remain overbought or oversold for prolonged periods, RSI alone may sometimes lack precise entry or exit points. However, when combined with other indicators or range boundaries, RSI becomes a powerful confirmation tool, helping traders avoid premature or delayed trades and focus on ranges with optimal risk-reward ratios.
What is Relative Strength Index (RSI) Indicator and how to use in trading
On-Balance Volume (OBV)
Volume plays an essential role in range trading by validating the strength of price movements within a range. On-balance volume (OBV) tracks the cumulative buying and selling volume, helping traders gauge the strength of the current trend or potential reversals at support and resistance levels. According to OBV theory, volume often precedes price; thus, rising volume supports an upward move, while declining volume may indicate a coming reversal. Before the price hits a support or resistance level, traders look for volume to start dropping. After the price bounces off these levels, a renewed volume increase reinforces the likelihood of the range holding steady.
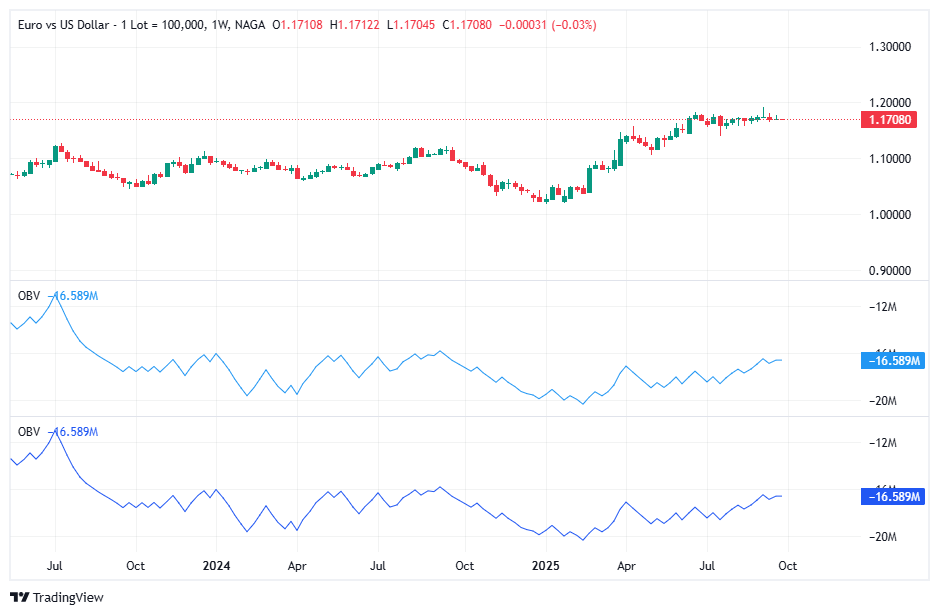
Past performance is not a reliable indicator of future results. All historical data, including but not limited to returns, volatility, and other performance metrics, should not be construed as a guarantee of future performance.
An essential aspect of OBV is its ability to highlight fake breakouts. If volume fails to increase significantly after breaching support or resistance, the breakout might not be genuine, suggesting the range will likely hold. Conversely, if volume surges as the price breaks through key levels, it may indicate the beginning of a new trend, signaling traders to reconsider their range-bound positions. This makes OBV a crucial indicator in avoiding false signals and improving the accuracy of range trading strategies.
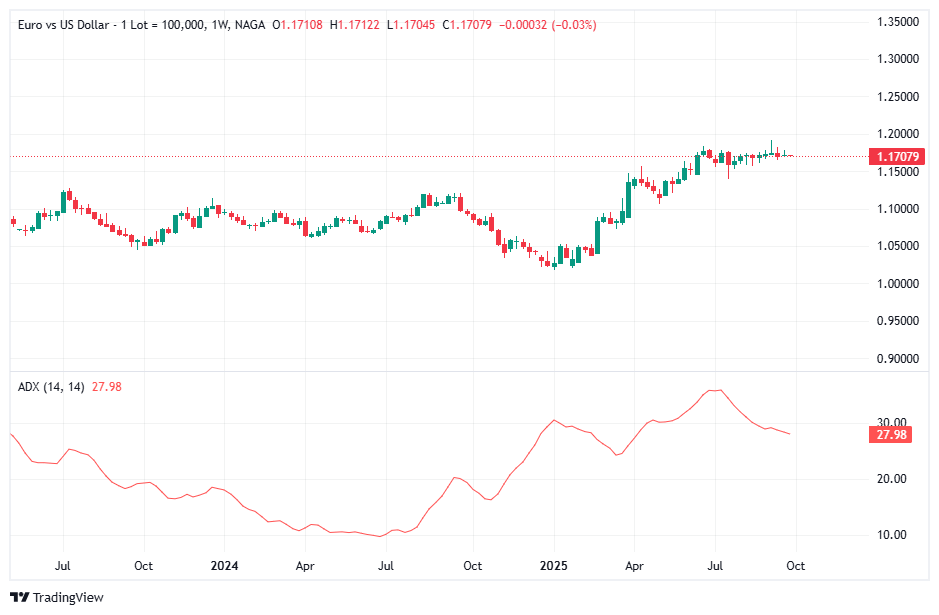
Average Directional Index (ADX)
The Average Directional Index (ADX) measures the strength of a trend, and although it’s commonly used in trend trading, it’s also valuable in range trading. The ADX appears as a single line below the price chart, with values ranging from 0 to 100. When the ADX is above 25, it indicates a strong trend, while readings below 20 suggest a weak or absent trend. For range traders, a low ADX value (typically below 25) suggests a stable range-bound environment, while an ADX crossing above 25 can signal an impending breakout, as the trend’s strength starts to increase.
Past performance is not a reliable indicator of future results. All historical data, including but not limited to returns, volatility, and other performance metrics, should not be construed as a guarantee of future performance.
By monitoring the ADX, range traders can determine if the market is likely to stay within a range or if a breakout is imminent. For example, if a range-bound market with low ADX values suddenly shows a rising ADX, this could be an early warning that the price might breach support or resistance levels. By using ADX alongside other indicators like pivot points and RSI, traders gain additional insight into when to expect stability within the range and when to prepare for a breakout, making ADX a valuable addition to any range trading toolkit.
What is Average Directional Index (ADX) Indicator and how to use in trading
Pros and Cons of Range Trading
Pros Cons Simple Strategy: Range trading is a relatively straightforward strategy to implement. The concept involves buying at support and selling at resistance, making it easier to follow compared to more complex strategies. The price behavior in a range-bound market tends to be predictable and steady, providing clear guidelines for placing take-profit and stop-loss orders. This simplicity makes range trading appealing to both novice and experienced traders alike. Limited Profits: One downside of range trading is the limited profit potential. Since take-profit levels are typically set close to the entry price, the profits from each trade are often relatively small. To maximize earnings, traders need to make multiple trades within the same range, which can be time-consuming and may not result in significant gains. Additionally, this strategy often requires frequent trading, which can accumulate transaction costs and erode profits over time. Fast Turnaround: Trades in a range-bound market typically have a short turnaround time. Prices move quickly between support and resistance levels, allowing traders to enter and exit the market within a brief time frame. This characteristic is particularly beneficial for short-term traders who prefer not to leave their capital exposed for long periods. The fast-paced nature of range trading makes it a suitable technique for traders seeking quick profits without prolonged market exposure. Identifying Entry and Exit Points: A key challenge in range trading is accurately identifying the best times to enter and exit the market. While support and resistance levels offer general guidelines, they are often more like zones rather than precise price points, making it difficult to pinpoint the optimal entry and exit. Finding favorable risk/reward ratios can also be tricky, as the market may not always respect these levels with perfect accuracy. This can make range trading a bit more complex than it initially appears. Relevant to Every Market: Range trading strategies can be applied across various markets, whether in stocks, commodities, currencies, indices, or cryptocurrencies. Almost every market experiences periods where prices fluctuate within a range, making range trading adaptable to different asset types. Regardless of the market being traded, the principles of range trading remain consistent, ensuring its broad applicability. Breakout Risk: The biggest risk in range trading is the potential for breakouts. While prices tend to stay within a range for a period, they can eventually break out of the established boundaries. When this happens, traders can experience significant capital losses, especially if they don't use stop-loss orders to protect their positions. Breakouts are often powerful and may lead to rapid price movements in a direction that goes against the trader's position, making it a considerable risk to manage when range trading.
How to Start Range Trading with Naga.com
- Open an Account. Create an account with Naga quickly and easily to get started with range trading.
- Select a Trading Market. Choose a specific market to trade in; some trend traders focus on a single market, while others diversify across multiple markets to capture broader trends.
- Implement a Risk Management Plan. Use stops and limits to protect your trades. Limit orders help lock in profits, while stop-loss orders close out positions if the market moves against you. A solid risk management strategy is essential to handle potential trend reversals effectively.
Final words
Range trading offers traders an effective strategy for navigating the fluctuating financial markets. By focusing on markets that are moving within a defined range, traders can take advantage of predictable price movements between support and resistance levels. This approach allows traders to make informed decisions by buying near the lower boundary of the range and selling close to the upper boundary. Range trading is particularly useful in non-trending markets, where price fluctuations are more common than sustained directional trends. This makes it a versatile strategy that can be applied across various market conditions and timeframes, providing opportunities for both short-term and long-term traders.
The success of range trading largely depends on the ability to identify key technical indicators, such as pivot points, the relative strength index (RSI), on-balance volume (OBV), and the average directional index (ADX). By using these tools, traders can accurately pinpoint entry and exit points within the range and make well-informed decisions. However, like any trading strategy, range trading requires careful risk management and a solid understanding of market trends. While range trading can be a less stressful approach compared to trend trading, it still demands patience and precision. In conclusion, range trading is a powerful tool for profiting from sideways markets, and when combined with the right technical analysis, it can significantly enhance a trader's chances of success.
Trading tools
Before you start with range trading, you should consider using the educational resources we offer like NAGA Academy or a demo trading account. NAGA Academy has lots of free trading and investing courses for you to choose from, and they all tackle a different financial concept or process – like the basics of analyses – to help you to become a better trader or make more-informed investment decisions.
Our demo account is a suitable place for you to learn more about leveraged trading, and you’ll be able to get an intimate understanding of how CFDs work – as well as what it’s like to trade with leverage – before risking real capital. For this reason, a demo account with us is a great tool for investors who are looking to make a transition to leveraged trading.
Sources:
- https://www.cmegroup.com
- https://www.cfainstitute.org/insights/professional-learning/refresher-readings/2024/trade-strategy-execution
- https://research.stlouisfed.org/wp/more/2011-001