


There are several types of Doji candles that can occur on a candlestick chart. Depending on where the Doji occurs, each one provides different information to the trader. A Doji could look like a plus sign, a T, or an upside-down T. In certain contexts, a Doji candlestick could indicate that the price is near a topping or bottoming point. At other times, it means that the price may move sideways. Where the Doji occurs in a trend is key to its interpretation.
Here are the most popular Doji candle strategies and how to trade the Doji candlestick pattern with a favourable risk/reward ratio.
How to use the Doji candlestick pattern trading guide
- To get the most out of this guide, it’s recommended to practice putting these Doji trading strategies into action.
- The best risk-free way to test these strategies is with a demo account, which gives you access to our trading platform and $10,000 in virtual funds for you to practice with.
- Once you feel confident about your strategy it’s time to upgrade to a fully funded live account where you can apply your newfound edge.
- Alternatively, copy the moves of top-performing traders in real time with NAGA Autocopy.
What is Doji candle
“Doji” is Japanese for “at the same time.” They depict time frames when the closing price is the same, or very nearly the same, as the open.
Doji lines are among the most important individual candlestick patterns, according to Steve Nison, the father of candlestick charts, and can also be important components of other multiple-reversal candlestick patterns.
Doji form when a stock, cryptocurrency, commodity, or forex pair open and close are virtually equal. The length of the upper and lower shadows can vary, with the resulting candlestick looking like a cross, inverted cross, or plus sign. Alone, Doji are neutral patterns. Any bullish or bearish bias is based on preceding price action and future confirmation. The word “Doji” refers to both the singular and plural form.

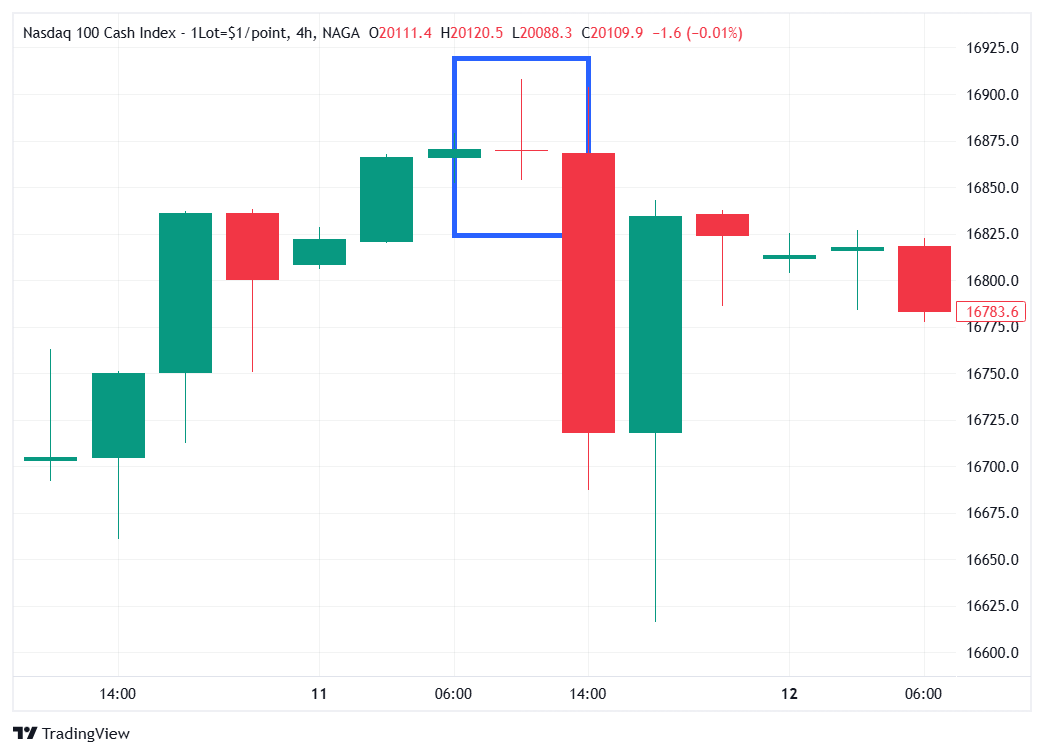
For illustrative purposes only
Ideally, but not necessarily, the open and close should be equal. While a Doji with an equal open and close would be considered more robust, it is more important to capture the essence of the candlestick. Doji conveys a sense of indecision or tug-of-war between buyers and sellers. Prices move above and below the opening level during the session but close at or near the opening level. The result is a standoff. Neither bulls nor bears were able to gain control, and a turning point could be developing.
Different assets have different criteria for determining the robustness of a Doji. Determining the robustness of the Doji will depend on the price, recent volatility, and previous candlesticks. Relative to previous candlesticks, the Doji should have a very small body that appears as a thin line. Steven Nison notes that a Doji that forms among other candlesticks with small real bodies would not be considered important. However, a Doji that forms among candlesticks with long real bodies would be deemed significant.
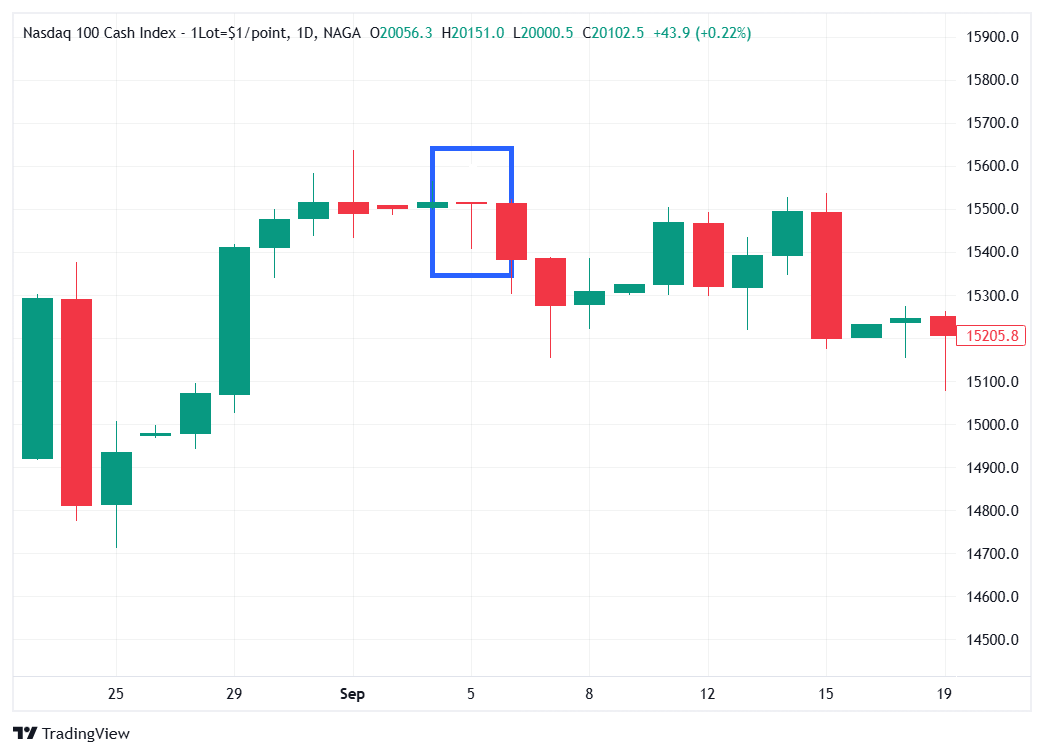
How is a Doji candlestick formed?
The relevance of a Doji depends on the preceding trend or preceding candlesticks. After an advance, or long white candlestick, a Doji signals that the buying pressure is starting to weaken. After a decline, or long black candlestick, a Doji signals that selling pressure is starting to diminish. Doji indicates that the forces of supply and demand are becoming more evenly matched and a change in trend may be near. Doji alone are not enough to mark a reversal, and further confirmation may be warranted.
After an advance or long white candlestick, a Doji signals that buying pressure may be diminishing and the uptrend could be nearing an end. Whereas security can decline simply from a lack of buyers, continued buying pressure is required to sustain an uptrend. Therefore, a Doji may be more significant after an uptrend or long white candlestick. Even after the Doji forms, further downside is required for bearish confirmation. This may come as a gap down, long black candlestick, or decline below the long white candlestick's open price. After a long white candlestick and Doji, forex traders should be on the alert for a potential evening Doji star.
After a decline or long black candlestick, a Doji indicates that selling pressure may be diminishing and the downtrend could be nearing an end. Even though the bears are starting to lose control of the decline, further strength is required to confirm any reversal. Bullish confirmation could come from a gap up, long white candlestick or advance above the long black candlestick's open. After a long black candlestick and Doji, traders should be on the alert for a potential morning Doji star.
Technical analysis of a Doji candle
Technical analysis is the field of studying chart patterns and price movements to determine where the price of an asset may go next. Technical analysis helps to provide information, which can hopefully then be turned into a profitable trade. Before analyzing
Doji candles, traders may ask themselves some questions that relate to the context of the candlestick trade:
- What is occurring on the candlestick chart before the Doji pattern forms?
- Is the price moving higher overall in an uptrend?
- Is the price moving lower within an overall uptrend (known as a pullback)?
- Is the price in a downtrend? Is the price in a pullback within an overall downtrend?
- Is the price moving sideways or in a triangle pattern?
- Is the Doji pattern near support or resistance?
Answering these questions can provide insight into where an instrument’s price may move after Doji forms. Technical analysis can be used when analyzing Doji candlestick patterns to signal potential trading opportunities. Now that we know some technical analysis concepts and questions to keep in mind, we will look at the various Doji chart types and discuss some ideas on how to trade them.
Doji candlestick types
Some common Doji candlestick chart patterns include the dragonfly Doji, Gravestone Doji, Long-legged Doji, and variations. Each has a slightly different shape, which we discuss in more detail below.
Long-Legged Doji
For illustrative purposes only
Long-legged Doji have long upper and lower shadows that are almost equal in length. These Doji reflect a great amount of indecision in the market. Long-legged Doji indicate that prices traded well above and below the session's opening level but closed virtually even with the open. After a whole lot of yelling and screaming, the result showed minor change from the initial open.
Dragonfly Doji
For illustrative purposes only
Dragonfly Doji form when the open, high, and close are equal and the low creates a long lower shadow. The resulting candlestick looks like a “T” due to the lack of an upper shadow. Dragonfly Doji indicates that sellers dominated trading and drove prices lower during the session. By the end of the session, buyers resurfaced and pushed prices back to the opening level and the session high.
The reversal implications of a dragonfly Doji depend on previous price action and future confirmation. The long lower shadow provides evidence of buying pressure, but the low indicates that plenty of sellers still loom. After a long downtrend, long black candlestick, or at support, a dragonfly Doji could signal a potential bullish reversal or bottom. After a long uptrend, long white candlestick or at resistance, the long lower shadow could foreshadow a potential bearish reversal or top. Bearish or bullish confirmation is required for both situations.
Gravestone Doji forms when the open, low, and close are equal and the high creates a long upper shadow. The resulting candlestick looks like an upside-down “T” due to the lack of a lower shadow. Gravestone Doji indicates that buyers dominated trading and drove prices higher during the session. However, by the end of the session, sellers resurfaced and pushed prices back to the opening level and the session low.
As with the dragonfly Doji and other candlesticks, the reversal implications of gravestone Doji depend on previous price action and future confirmation. Even though the long upper shadow indicates a failed rally, the intraday high provides evidence of some buying pressure. After a long downtrend, long black candlestick, or at support, the focus turns to the evidence of buying pressure and a potential bullish reversal. After a long uptrend, long white candlestick or at resistance, the focus turns to the failed rally and a potential bearish reversal. Bearish or bullish confirmation is required for both situations.
How to trade Doji candlesticks
When you see the Doji candlestick pattern and you want to place a trade, you can do so via derivatives such as CFDs. Derivatives enable you to trade rising as well as declining prices. So, depending on what you think will happen with the asset’s price when one of the Doji patterns appears, you can open a long position or a short position.
Follow these steps to trade when you see the Doji candlestick chart pattern:
Trading any type of Doji candlestick pattern requires patience and the ability to wait for confirmation. The appearance of one of these Doji candles alerts traders of a price reversal, but until that occurs, most traders leave the pattern alone. To get started trading Doji candlesticks, open an account. Choose between a live account to trade CFDs straight away or practise first on our demo account with virtual funds. Choose your financial instrument. Doji candles can be spotted in most financial markets, especially those that are more volatile, such as forex, cryptocurrencies, and stocks. Explore our online trading platform. We offer multiple chart types that are not limited to candlestick charts, as well as providing a range of order execution tools for fast trading, which in turn helps you to manage risk.
The below strategies for trading Doji candlestick patterns are merely guidance and cannot be relied on for profit.
Doji trading strategies
Below we explore various Doji Candlestick strategies that can be applied to trading.
Trading with the Doji star pattern and indicators
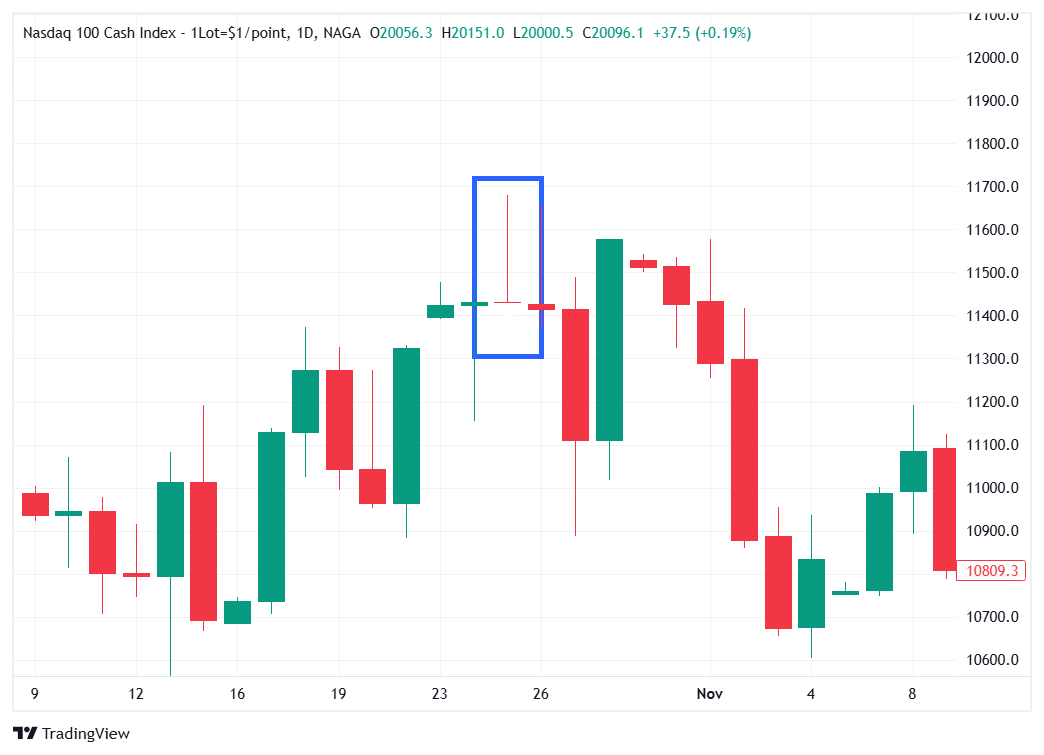
The chart below shows the Doji star appearing at the bottom of an existing downtrend. The Doji pattern suggests that neither buyers nor sellers are in control and that the trend could reverse. At this point, it is crucial to note that traders should look for supporting signals that the trend may reverse before executing a trade. The chart below makes use of the stochastic indicator, which shows that the market is currently in the overbought territory – adding to the bullish bias.
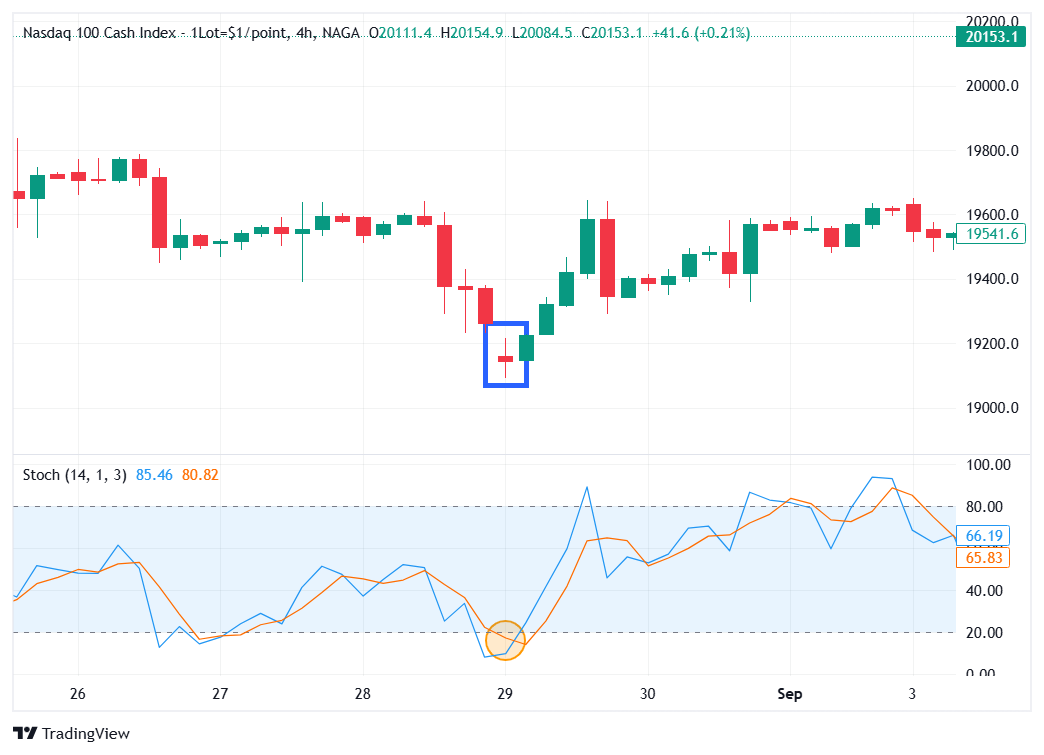
For illustrative purposes only
Using the Dragonfly Doji in Trend Trading
A popular Doji candlestick trading strategy involves looking for Dojis to appear near levels of support or resistance. The below chart highlights the Dragonfly Doji appearing near trendline support. In this scenario, the Doji doesn’t appear at the top of the uptrend as alluded to previously, but traders can still trade based on what the candlestick reveals about the market.
The Dragonfly Doji shows the rejection of lower prices and thereafter, the market moved upwards and closed near the opening price. This potential bullish bias is further supported by the fact that the candle appears near trendline support and prices had previously bounced off this significant trendline.
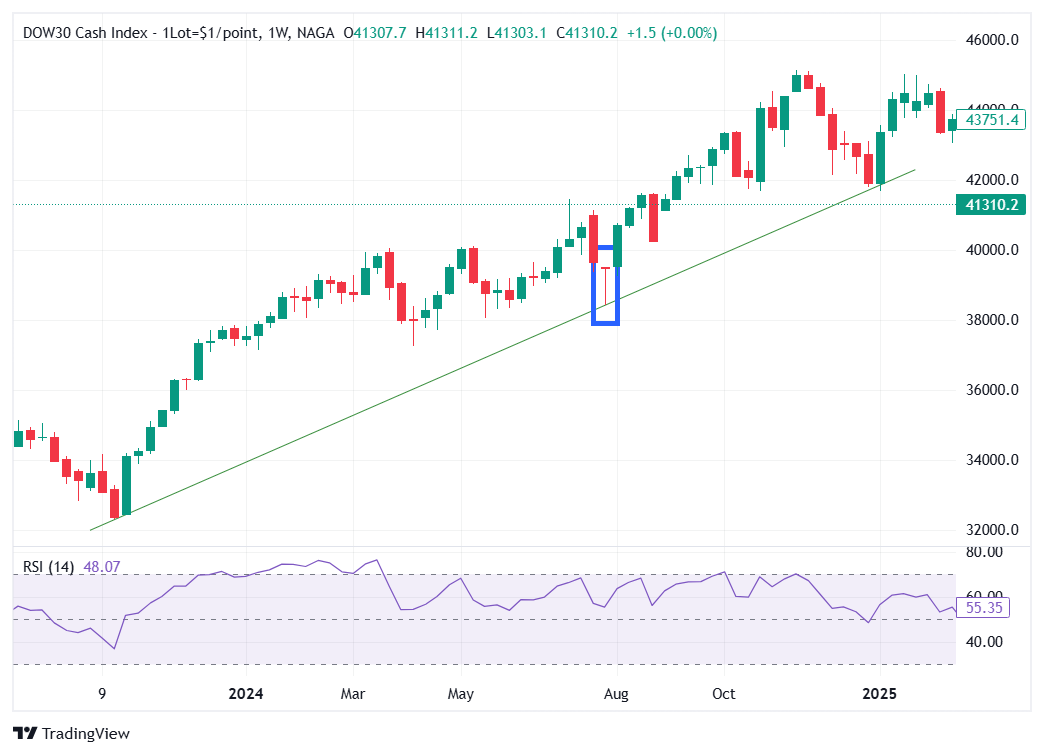
For illustrative purposes only
Double/Triple Doji trend continuation strategy
A single Doji is usually a good indication of indecision however, two or three Dojis (one after the other), present an even greater indication that often results in a strong breakout. The Double Doji strategy looks to take advantage of the strong directional move that unfolds after the period of indecision.
Traders can wait until the market moves higher or lower, immediately after the Double/Triple Doji. In the chart below, the entry point can be above the high of the three Dojis with a stop loss placed below the lows of the three Dojis.
Targets can be placed at a recent level of support however, breakouts with increased momentum have the potential to run for an extended period hence, a trailing stop should be considered.
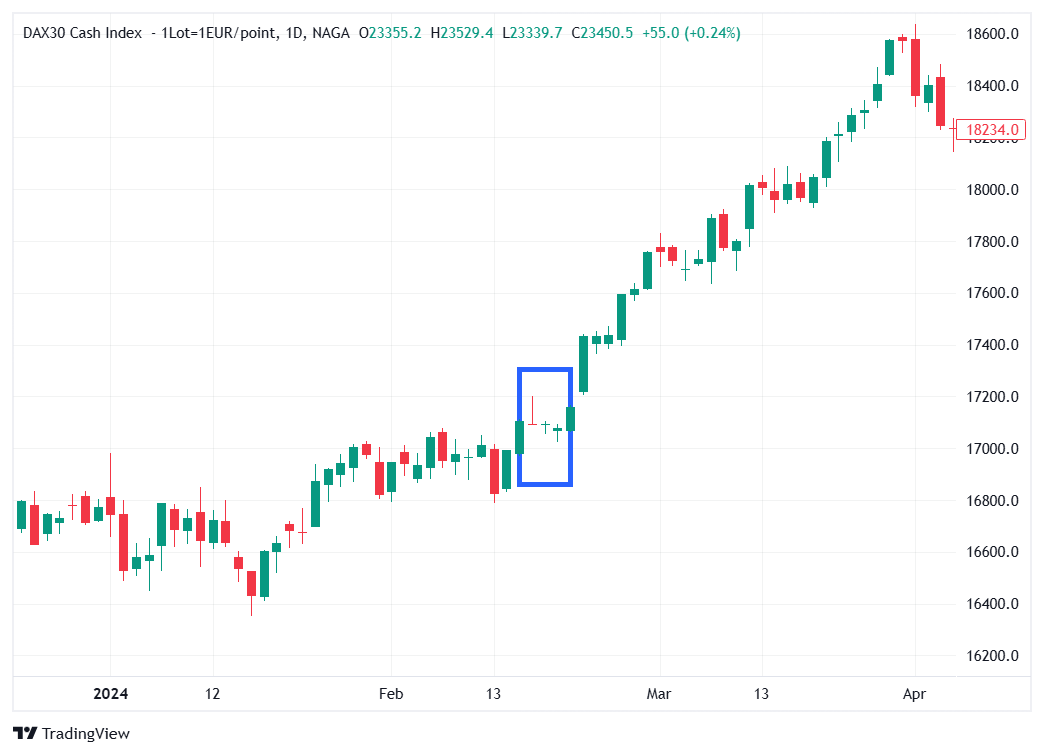
For illustrative purposes only
Final notes about Doji Patterns
As was presented above, the Doji formation can be created in two separate ways, but the interpretation of the Doji remains the same: the Doji chart pattern is a sign of indecision, neither bulls nor bears can successfully take over.
If a Doji appears after an uptrend, and especially if it follows a long, white-bodied candle, it represents indecision at a significant high, at a time when bulls should still be decisive. It can also be read as a sign that supply, and demand have reached equilibrium. Either way, it is seen as a warning that the uptrend is ending. (If it appears after a long decline, it warns that a downtrend is ending.)
There are many ways to trade the various Doji candlestick patterns. However, traders should always look for signals that complement what the Doji candlestick is suggesting executing higher probability trades, which can be technical indicators like Stochastic, MACD, or RSI that should show a bullish divergence and oversold with a Doji pattern appearing at the bottom or bearish divergence and overbought with Doji pattern appearing at the top. Additionally, it is essential to implement sound risk management when trading the Doji to minimize losses if the trade does not work out.
Summary
- For a bullish Doji, an option could be to place a buy order above the Doji high, then place a stop-loss below the low of the Doji. If the price does move higher, the entry is triggered, but risk is controlled in case the price drops after.
- For a bearish candlestick, a trader could place a short sell order below the Doji low, then place a stop-loss above the Doji high. If the price does drop, the entry is triggered, and the risk is controlled if the price moves back to the upside.
- For an exit, a trailing stop-loss could be used. You should also consider a risk/reward ratio to calculate your potential wins and losses.
- When you spot the Doji candlestick chart pattern, you can trade using derivatives such as CFDs
- With derivatives, you can go long or short because you do not own the underlying asset
Free trading tools and resources
Remember, you should have some trading experience and knowledge before you decide to trade candlestick patterns. You should consider using the educational resources we offer like NAGA Academy or a demo trading account. NAGA Academy has lots of free trading courses for you to choose from, and they all tackle a different financial concept or process – like the basics of analyses – to help you to become a better trader.
Our demo account is a great place for you to learn more about leveraged trading, and you’ll be able to get an intimate understanding of how CFDs work – as well as what it’s like to trade with leverage – before risking real capital. For this reason, a demo account with us is a great tool for investors who are looking to make a transition to leveraged trading.