USDJPY on a daily timeframe.
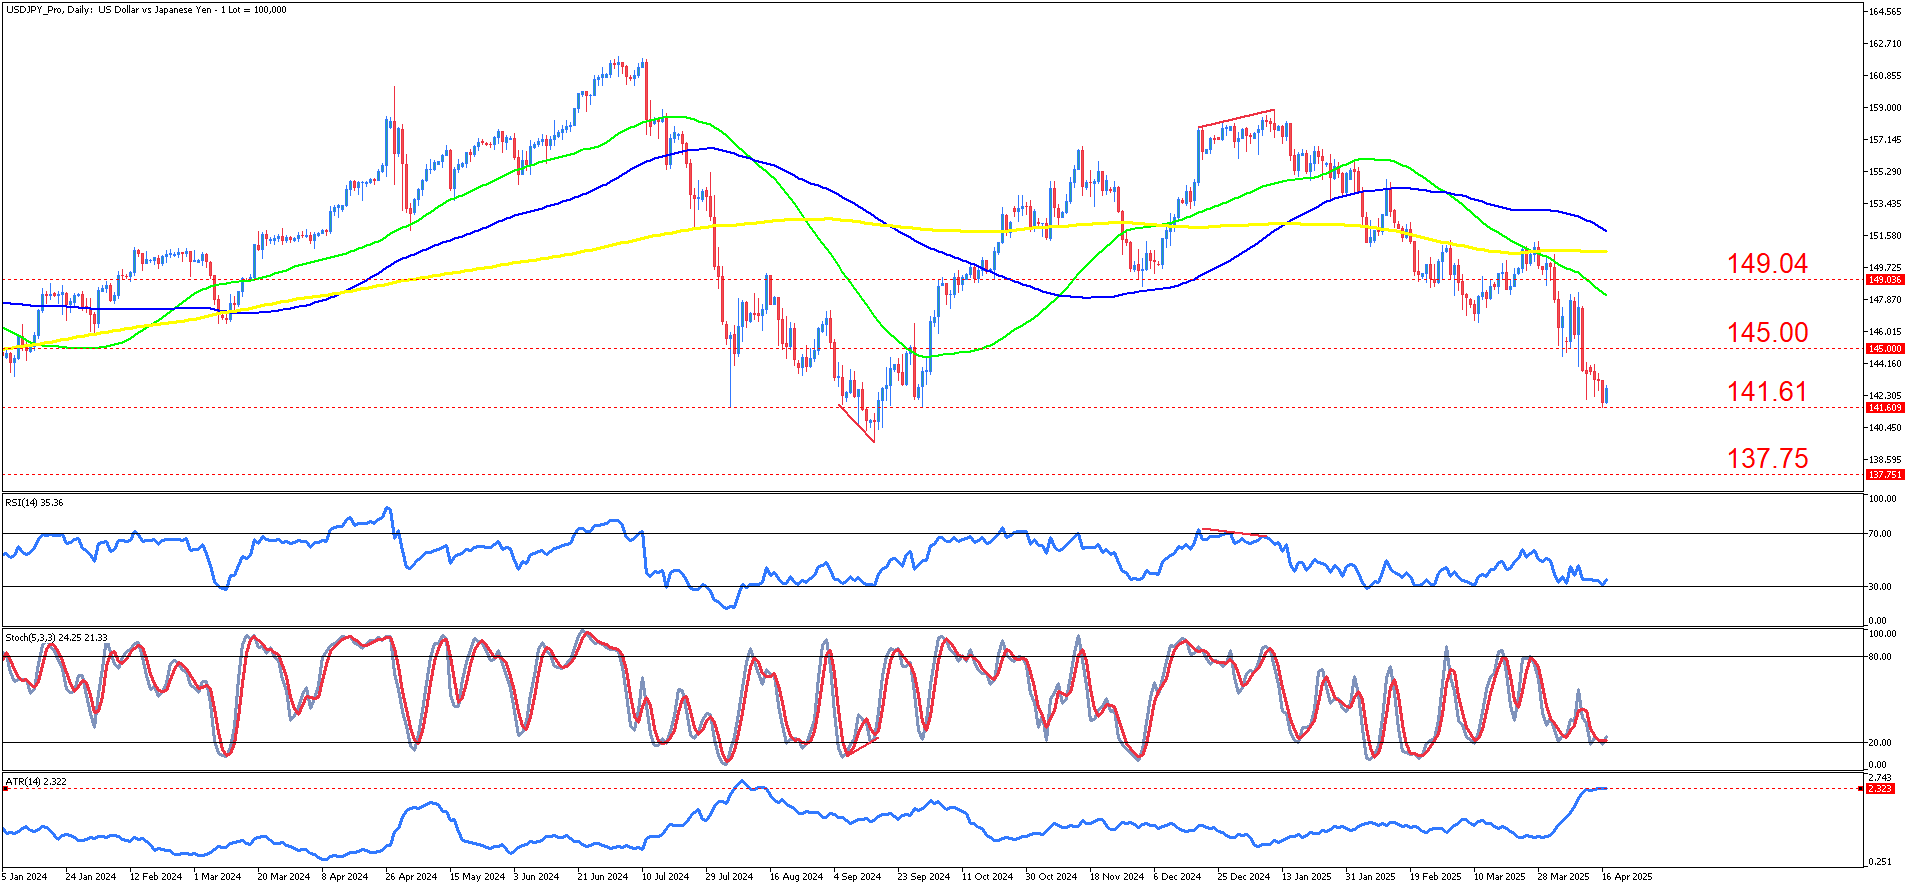
USDJPY on a daily timeframe. The pair exhibited a strong bullish trajectory from January through late June 2024, with a steep rise supported by the 50-day moving average (green) crossing above the 100-day (blue) and briefly above the 200-day (yellow) moving average, affirming the uptrend. However, a double-top formation around 160.20 in early November 2024 signaled a potential reversal. This was followed by a bearish divergence in the Relative Strength Index (RSI), as price made higher highs while RSI registered lower highs, weakening bullish momentum and hinting at an upcoming correction.
In recent sessions, the price has broken below all major moving averages, with the 50-day crossing under the 100-day and nearing the 200-day, further cementing a bearish reversal. The current price hovers just above the 141.61 support level after a decisive break below 145.00. Price action reflects strong bearish candles, and there's little evidence yet of buyers stepping in. The sharp decline since late March 2025 has wiped out prior gains and now approaches the 137.75 support level, a critical line last tested in early July 2024.
From an indicator standpoint, the RSI is near 35, approaching oversold territory but not yet showing reversal signals. The Stochastic Oscillator (5,3,3) remains in the lower bound, with lines slightly turning upward, hinting at a possible short-term retracement but not yet confirmed. Notably, the Average True Range (ATR) has risen significantly to 2.32, signaling heightened volatility and an increased probability of larger price swings. The earlier divergence in RSI and a similar pattern on the Stochastic preceding the March top validate the downward movement and underline bearish strength.
In the main scenario, if bears maintain control, the pair may soon test the 141.61 level decisively and move toward 137.75, a key demand zone. Sustained downward pressure and a failure to recover above 145.00 would increase the probability of a continued bearish trend. High ATR readings reinforce the potential for sharp moves in either direction, but overall structure favors continued downside.
Alternatively, if buyers defend the 141.61 zone and bullish divergence appears in the oscillators, the price may stage a recovery rally. A close back above 145.00 could expose the next resistance at 149.04. This move would require a shift in sentiment, possibly driven by weaker U.S. economic data or supportive actions by the Bank of Japan, and must be confirmed with volume and price closing above moving average resistances.
The recent weakness in USD/JPY is largely rooted in growing macroeconomic imbalances and diverging economic outlooks between the U.S. and Japan. Japan's economy has displayed underlying strength through resilient domestic indicators, supporting expectations of continued monetary tightening by the Bank of Japan. Meanwhile, the U.S. dollar faces downward pressure as markets price in potential Federal Reserve easing amid rising trade tensions and uncertainty surrounding the broader policy environment. These dynamics have increased demand for the Japanese yen as a relatively stable alternative in turbulent times.
Looking ahead, market participants are closely monitoring trade negotiations, central bank communications, and key U.S. economic releases for directional cues. Developments in U.S.-Japan trade talks, along with speeches by Fed officials, especially Chair Powell, are expected to shape near-term sentiment. Regular U.S. economic indicators—including jobless claims, housing data, and regional manufacturing indices—may further influence dollar expectations. In Japan, attention will shift to inflation and retail sales figures for additional clarity on the BoJ's policy path. The interplay of these macro factors is likely to keep USD/JPY sensitive to any surprises in policy tone or economic performance.
Summary:
- USD/JPY breaks down after double top at 160.20, with bearish RSI divergence confirming fading momentum.
- Price crashes below key moving averages, with 141.61 now in play and 137.75 emerging as the next major support.
- Volatility surges as ATR spikes, but oscillators hint at a possible short-term bounce — no clear reversal yet.
- Macro divergence fuels yen strength, as BoJ tightens while the Fed leans dovish amid growing U.S. economic uncertainty.