


SPX500 on a daily timeframe.
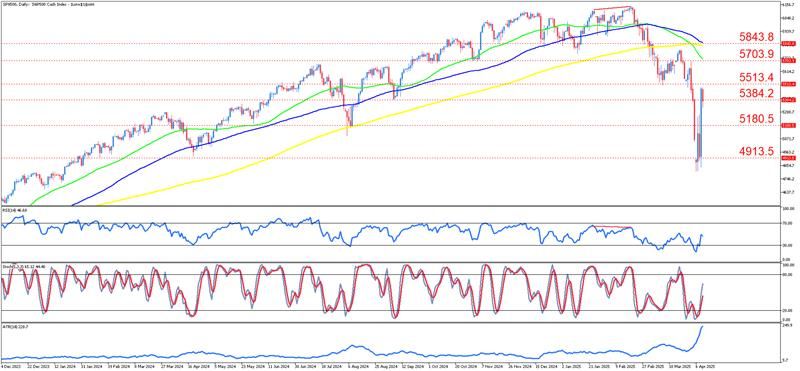
SPX500 on a daily timeframe. The index experienced a sustained uptrend for most of 2024, driven by resilient corporate earnings and stable macroeconomic indicators. However, the strong bullish trend began to unravel in early 2025, with price action decisively breaking below long-standing support levels and major moving averages. The convergence of the 50-day (green), 100-day (blue), and 200-day (yellow) simple moving averages has now reversed, reflecting a shift in trend momentum.
In recent sessions, the SPX500 has displayed exceptionally high volatility. After falling over 10% in just two days earlier this week due to renewed tariff fears, the index staged a historic rebound on April 9, posting a gain of more than 9%—its largest one-day rally since World War II. This dramatic surge was triggered by President Trump's announcement of a 90-day suspension of selected tariffs, which temporarily alleviated trade-related concerns and lifted investor sentiment. Despite this powerful recovery, the index remains well below key resistance levels such as 5513.4 and continues to trade under its major moving averages.
Momentum indicators are signaling a potential stabilization but remain mixed overall. The RSI has recovered to 46.68, still below the neutral 50 level, suggesting momentum is fragile. The Stochastic Oscillator has turned upward from oversold territory, with its %K and %D lines currently showing a bullish crossover near the mid-range. The Average True Range (ATR) has spiked to 228.7, confirming that price fluctuations have widened dramatically, a hallmark of highly uncertain and reactive market conditions.
In the main scenario, if the recent bullish thrust can find support above the 5180.5 or ideally the 5384.2 level, the SPX500 could extend its rebound toward 5513.4 and possibly challenge 5703.9 over the medium term. This would require a continuation of positive sentiment, potentially supported by better-than-expected inflation data or dovish signals from the Federal Reserve. However, with technical resistance converging near the moving averages, the upward path remains challenged.
An alternative scenario assumes the rally is a technical relief bounce within a broader bearish correction. Should price fail to hold above 5180.5 and retest the critical 4913.5 support zone, renewed selling pressure could emerge. A break below this level may accelerate the downtrend toward the 4700 region, particularly if inflation surprises to the upside or the upcoming earnings disappoint investor expectations.
Given the extreme volatility and rapid sentiment shifts, investors should remain cautious. The spike in ATR reflects instability, and any gains may prove short-lived without confirmation from fundamental drivers. Market participants should closely monitor technical levels while managing risk proactively, especially during periods of heightened news sensitivity.
The rally on April 9 was fueled by the suspension of certain tariffs, but analysts warn that structural concerns—including slowing economic growth and rising inflation—remain unresolved. The earnings outlook for the S&P 500 has been revised downward, with Q1 results expected to show a notable contraction. On April 11, the U.S. CPI report and FOMC meeting minutes will be released, both of which could significantly shift expectations regarding Fed policy. Additional data points, including PPI, weekly jobless claims, and consumer sentiment, will follow on April 12. Furthermore, earnings results from major U.S. banks at the end of the week will offer key insight into how financial institutions are managing economic uncertainty. These events are likely to sustain volatility and influence near-term market direction.
Summary:
- SPX500 breaks key support levels and moves below major moving averages, signaling a shift in trend momentum after a strong 2024 uptrend.
- A historic 9% rebound occurred on April 9, triggered by tariff suspension, but resistance at 5513.4 remains.
- Mixed momentum indicators suggest potential stabilization, though volatility remains high with the ATR spiking to 228.7.
- The market faces two scenarios: a sustained rebound with positive sentiment or a technical bounce within a bearish correction, depending on key support levels and upcoming economic data.


