
Past performance is not indicative of future results. All historical data, including but not limited to returns, volatility, and other performance metrics, should not be construed as a guarantee of future performance.
NASDAQ 4 Hour Timeframe
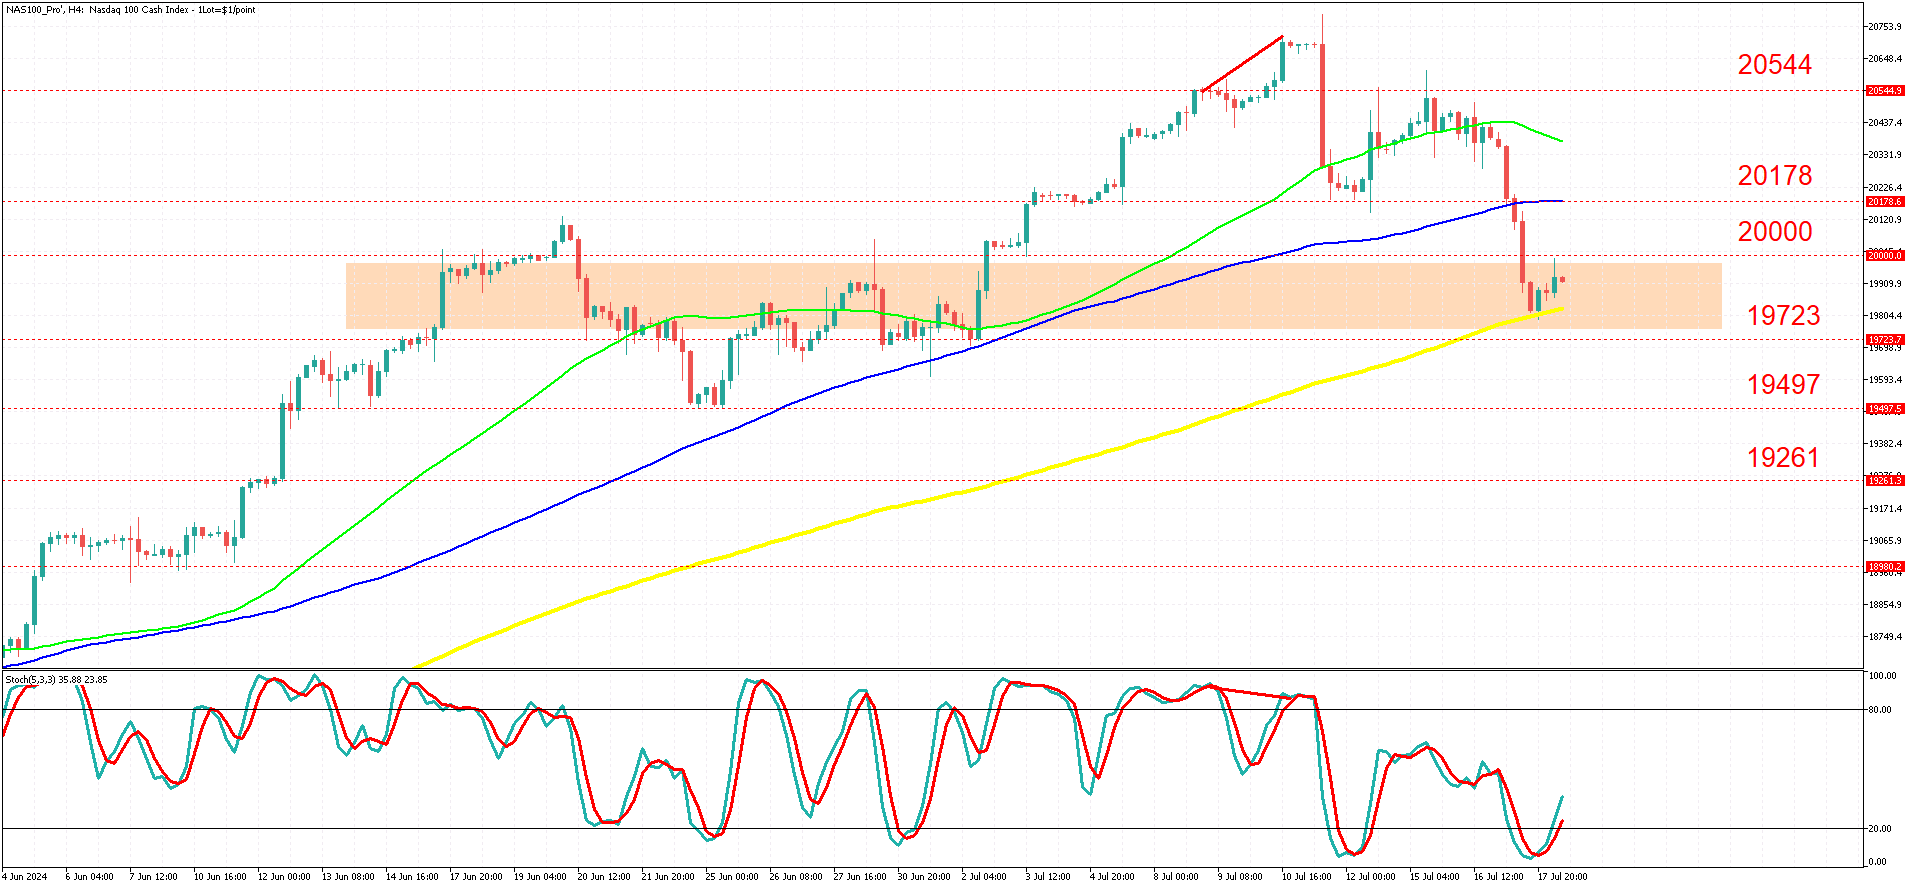
The NASDAQ, on a 4-hour timeframe, appreciated from 18,235 to a recent high of 20,793, marking a 14% growth in less than two months. In contrast, the S&P 500 only rose by 9%. This disparity appears to be partly due to the current AI wave attracting many investors.
During this uptrend, there was a brief period of consolidation just before reaching the significant psychological level of 20,000. On July 11th, the market experienced a sharp decline following the formation of a bearish divergence between the stochastic oscillator and price action.
Currently, the market is trading between the 19,723 and 20,000 levels, an area historically known for consolidation.
Price action indicates that we may be entering a longer-term downward correction, having surpassed the 61.8 Fibonacci retracement level and forming lower lows and lower highs. If the market convincingly breaks below 19,723 (or the 200-period SMA), potential targets could be 19,497 and 19,261.
However, in the short term, there may be potential for an upward move, with the price rebounding off the 200-period simple moving average and the stochastic oscillator being oversold. If the price breaches the 20,000 level again with conviction, we can anticipate moves towards 20,178 and 20,544. These would be counter-trend moves, so traders might consider using tighter stops and taking profits earlier than usual.
It is essential to monitor shifting market sentiment and fundamental drivers, particularly in relation to the US Dollar.
Summary:
- NASDAQ surged 14% in less than two months, significantly outpacing the S&P 500's growth, largely due to investor interest in the AI sector.
- After reaching the psychologically important 20,000 level, the market showed a bearish divergence between the stochastic oscillator and price action.
- Current trading occurs between 19,723 and 20,000, historically a consolidation zone.
- Technical indicators suggest a potential long-term downward correction, with possible targets at 19,497 and 19,261.
- In the short term, an upward bounce is possible, with potential targets at 20,178 and 20,544, but such moves should be considered counter-trend.