


Past performance is not indicative of future results. All historical data, including but not limited to returns, volatility, and other performance metrics, should not be construed as a guarantee of future performance.
XAUUSD on a 1-Hour Timeframe
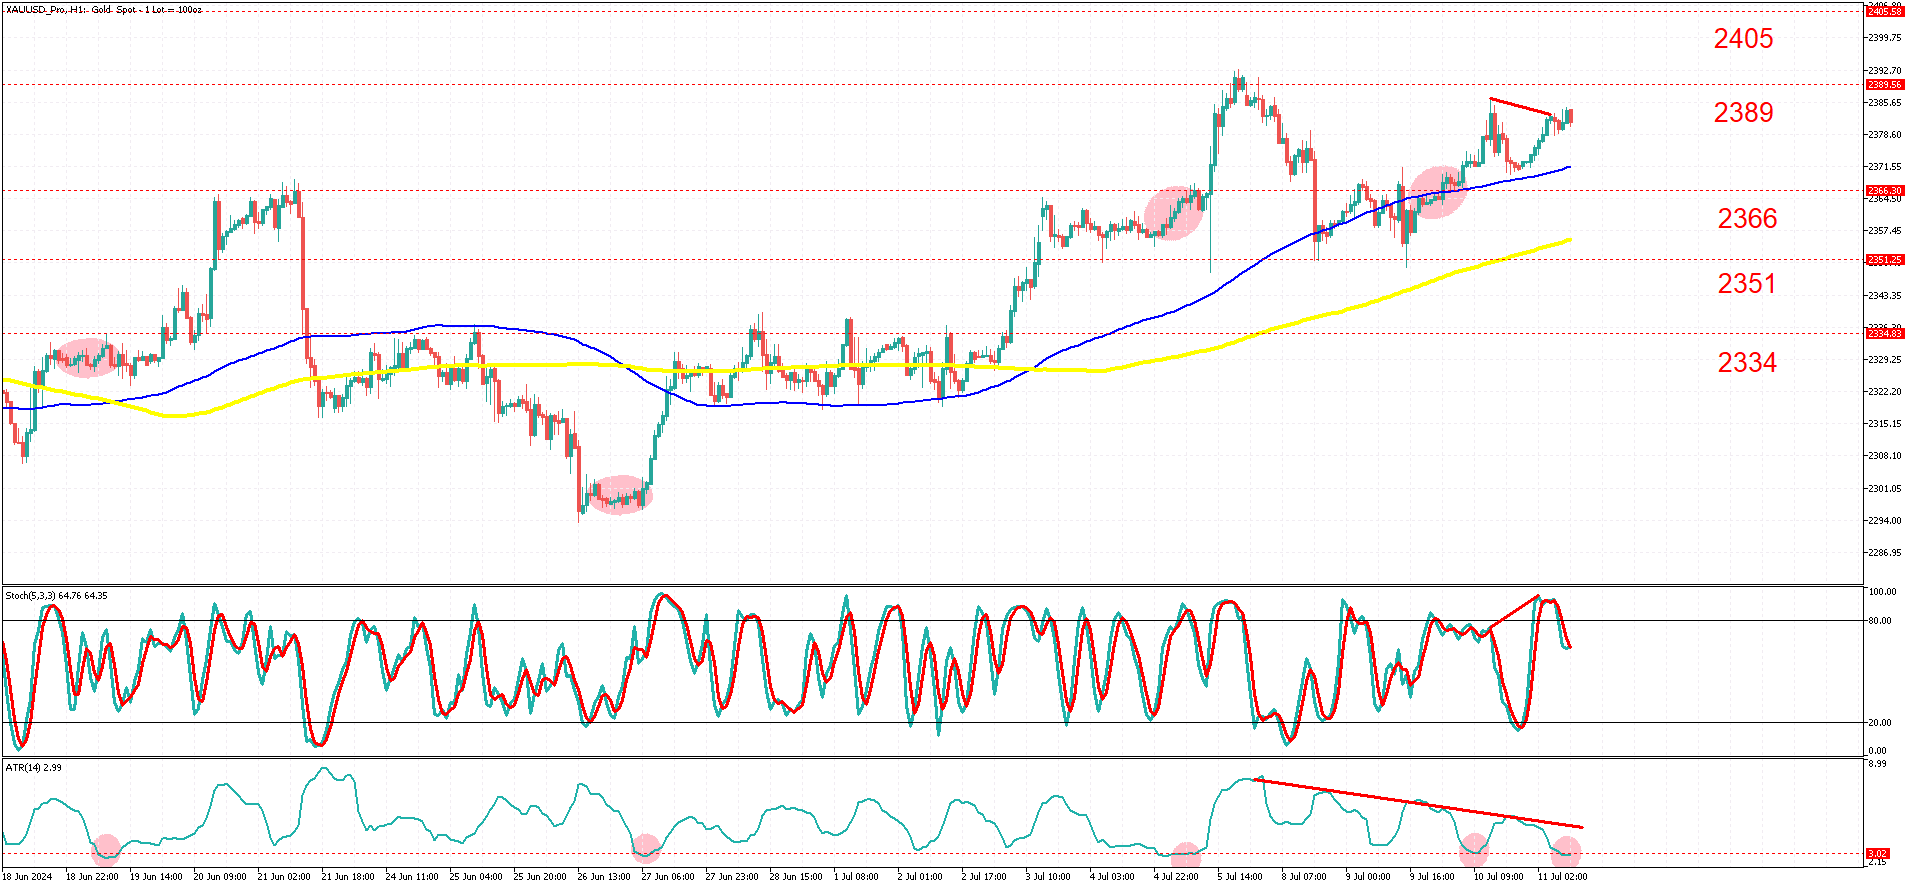
Over the past month, gold has shown a largely sideways movement on the hourly chart, with a modest 2.7% increase overall. This period has been marked by notable intraday volatility, driven by strong and sometimes conflicting fundamental data.
Recently, the market has entered a consolidation phase with decreasing volatility. This period of low activity has led to the formation of hidden bearish divergence between price action and the stochastic oscillator. Hidden bearish divergence occurs when price forms lower highs while the oscillator forms higher highs. This rare phenomenon warrants close attention.
The current low volatility is particularly significant. Historical patterns (highlighted by red circles on the chart) show that similar low-volatility periods were followed by sharp breakouts.
According to the volatility cycle phenomenon, low volatility typically precedes high volatility (breakouts). Although recent breakouts have been upward, it’s important to note that volatility itself doesn’t predict the direction of breakouts, only the increased likelihood of their occurrence.
Despite the 100 and 200-period moving averages indicating an uptrend, there is a slight short-term downward bias. This is due to unchallenged resistance levels and the divergence, which suggest a potential mean-reverting scenario (a market correction back to the moving averages).
If the market fails to break above the 2389 resistance level, a potential drop to the 2366 and 2351 levels could occur, specifically targeting the 200-period SMA, which acts as dynamic support and resistance.
Conversely, if the bulls manage to convincingly push the price above the recent high of 2389, the next target might be 2405 before a possible pause.
The current low volatility may also indicate that investors are awaiting significant economic releases, such as the CPI report due later today, before making significant moves in the market.
Stay alert to these potential market-moving events and shifts in sentiment.
Summary:
- Gold showed sideways movement with a modest 2.7% increase over the past month.
- Hidden bearish divergence observed between price action and stochastic oscillator.
- Current low volatility period historically precedes sharp breakouts in gold.
- Short-term downward bias despite uptrend indicated by moving averages.
- Key resistance level at 2389, with potential drops to 2366 and 2351 if not broken.
- Market awaits significant economic releases, particularly the CPI report, for direction.


