


Gold had been trading within a narrow range on a 4-hour timeframe until a bullish surge on March 1, 2024, propelled prices upward from 2026 to a recent peak of 2193. This sudden move demonstrates significant strength but lacks sustainability, necessitating robust fundamental drivers to sustain further upward momentum without undergoing a retracement or consolidation phase.
Our long-term perspective aligns with the prevailing uptrend, although we anticipate a potential correction to the downside, possibly even a reversal in trend, contingent upon fundamental factors.
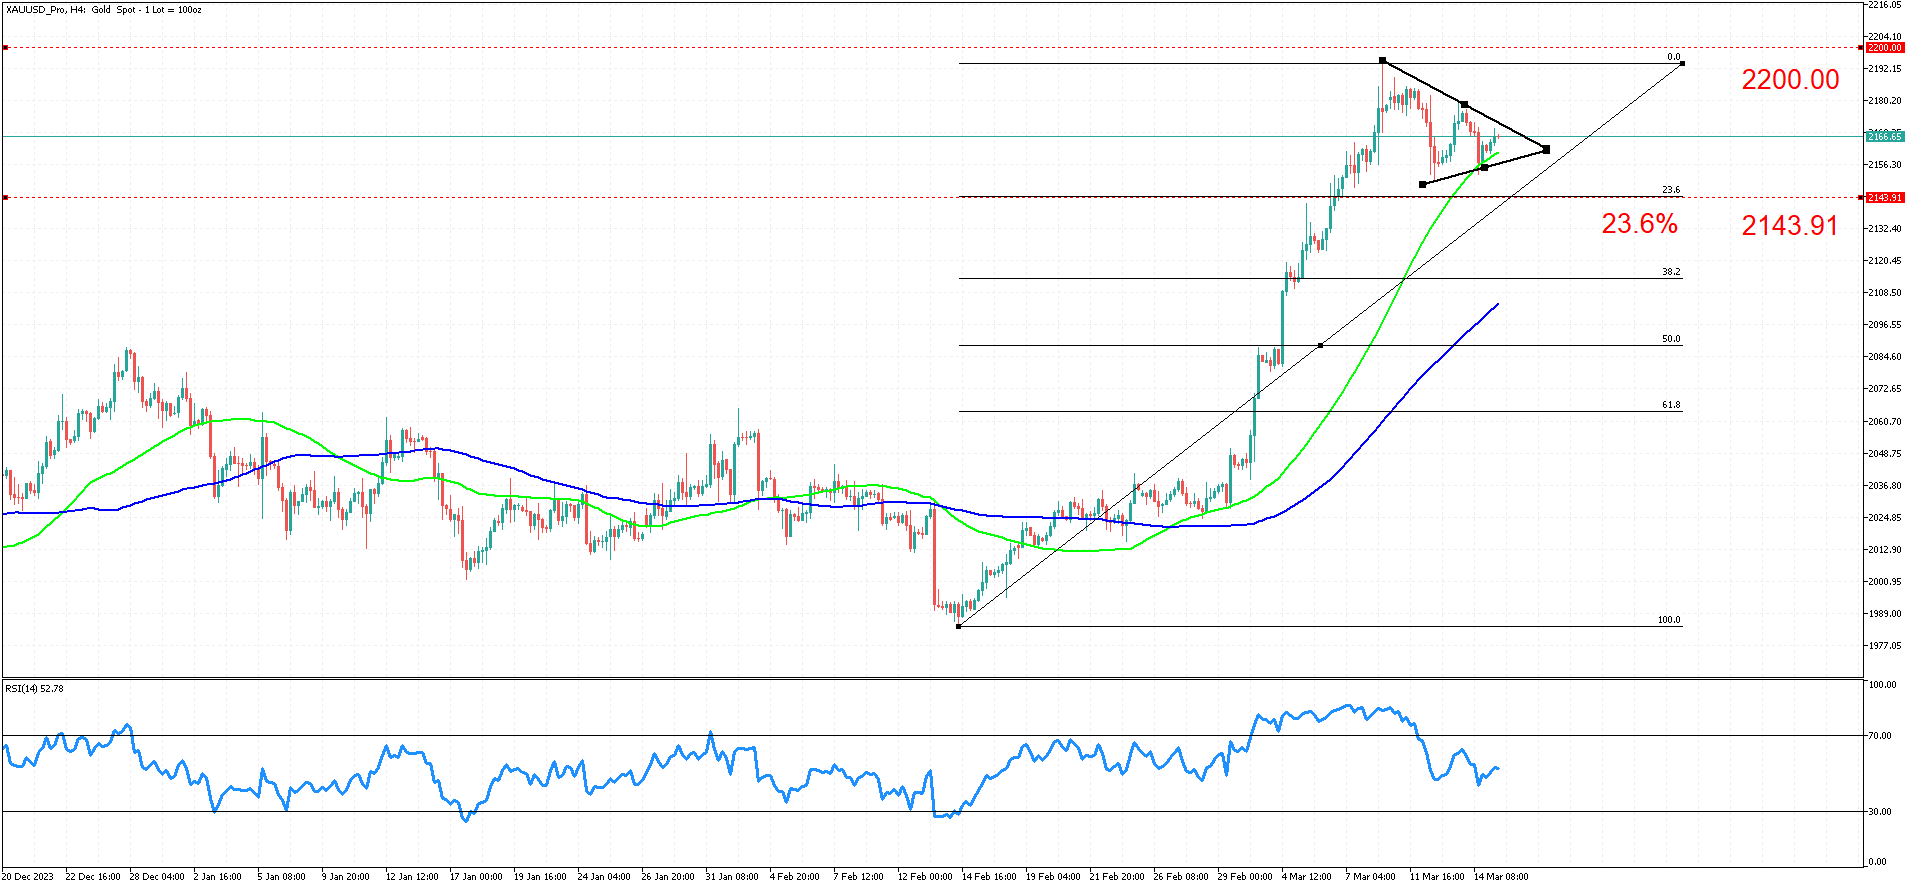
Gold is currently consolidating within a triangular pattern, characterized by diminishing volatility and subsequent formation of lower highs and higher lows, a pattern often indicative of imminent strong breakouts.
Analysis of the 50 and 100 period simple moving averages suggests an ongoing uptrend. However, there exists a possibility of retracement towards the zone of the 50/100 period moving averages, recognized as reliable dynamic support and resistance levels for Gold.
In the event of a downside break, the next significant target is the December 3, 2023 peak at the 2143 level, coinciding with the 23.6% Fibonacci retracement level. Subsequently, the 38.2% Fibonacci level at 2113 becomes the next target for the downward movement.
Conversely, in the case of an upside break, the major psychological level of 2200 emerges as a notable target, slightly surpassing the recent high.
When trading breakouts, two approaches merit consideration. The first entails trading as the breakout transpires, potentially yielding higher profits per successful trade but also increasing the risk of trading false moves. The second option involves waiting for a retracement, which may enhance the probability of a successful trade but could result in missed opportunities or reduced profits per trade, contingent upon each trader's risk tolerance.
Absence of robust fundamental drivers or a shift in sentiment may indicate Gold's readiness for a retracement before potentially charting new highs.
Summary:
- Gold broke out of its trading range on March 1, 2024.
- The breakout nearly reached the 2200 level before consolidating into a triangle pattern.
- A breakout is expected soon, with a preference for a downside move if fundamentals and sentiment remain stable.
- The initial target is 2143.91, aligned with the 23.6% Fibonacci retracement level from the December 1, 2023 high.
- The second target is the 38.2% Fibonacci level at 2113.
- Alternatively, an upside breakout could target the psychological level of 2200.


