


Past performance is not indicative of future results. All historical data, including but not limited to returns, volatility, and other performance metrics, should not be construed as a guarantee of future performance.
XAUUSD 4-Hour timeframe
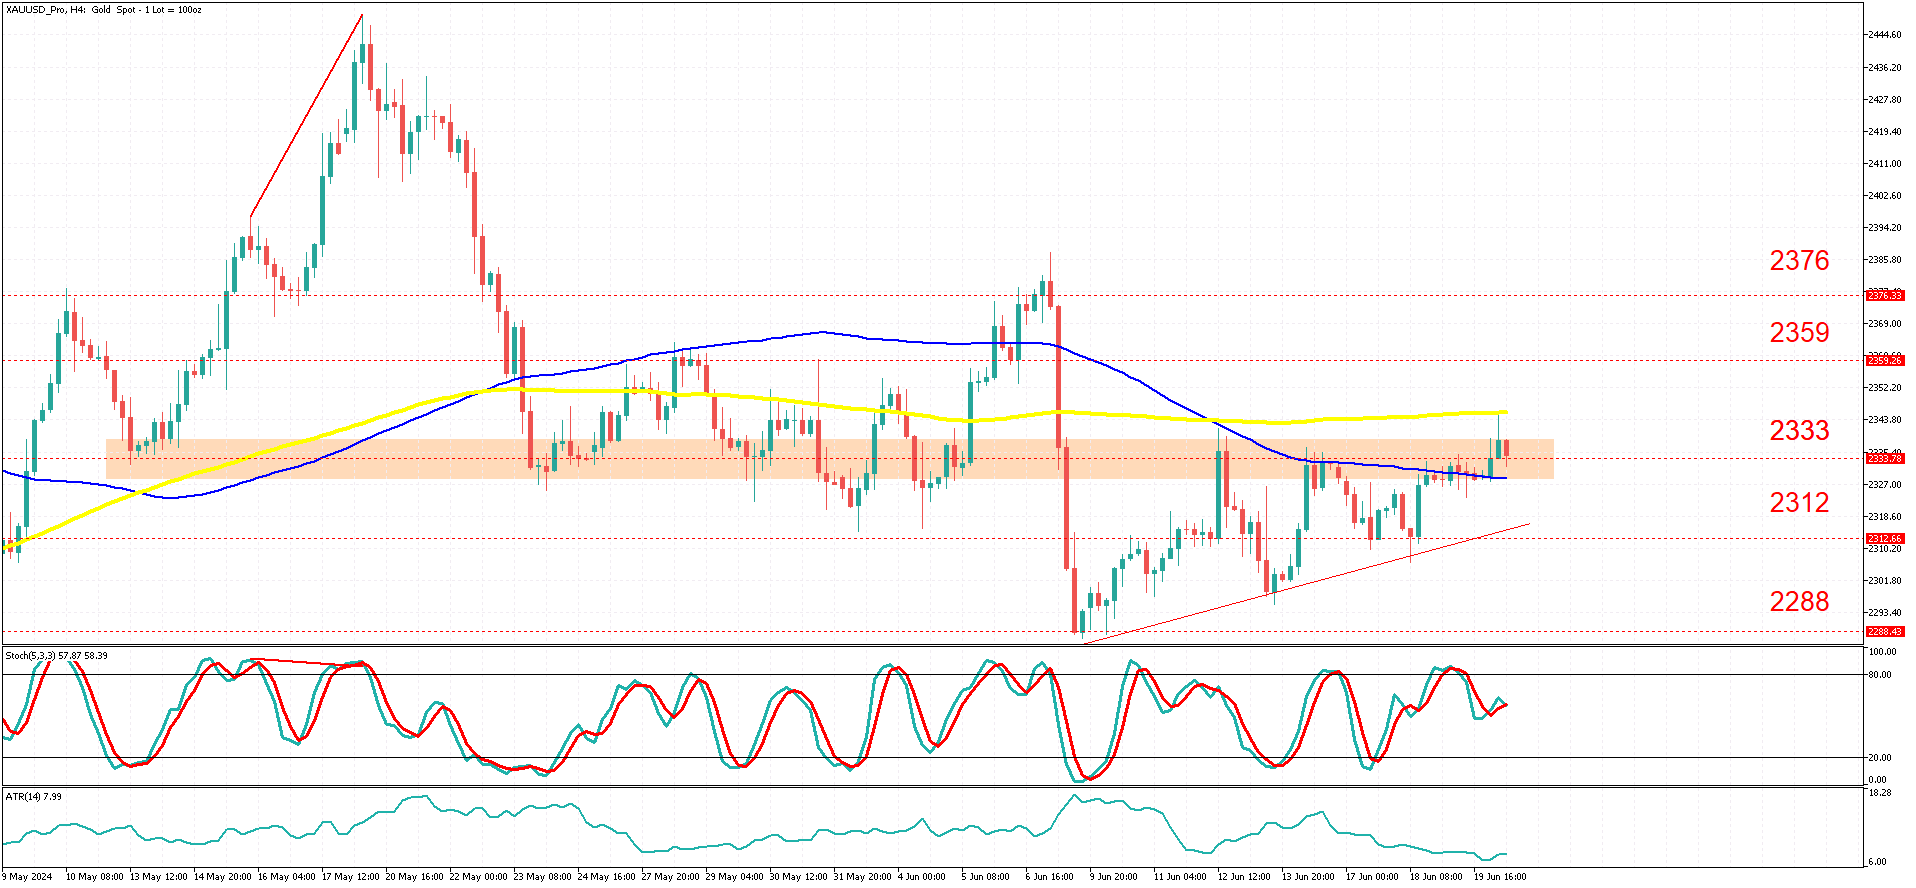
Gold Bulls Face Resistance at $2,333 Level — What's Next?
On a 4-hour timeframe, Gold experienced a strong rally, reaching a high of $2,450 on May 20, 2024. This final surge was marked by a Classical Bearish Divergence between the price action and the Stochastic Oscillator, illustrated by red lines where the price made higher highs while the Stochastic Oscillator made lower highs. Following this, the market saw a sharp decline, then moved sideways, and recently made another downward move.
Over the past two weeks, the market has gradually pushed higher, touching the 200-period simple moving average (SMA) several times. The 100 and 200-period SMAs are well-respected in gold, often acting as strong dynamic support or resistance. We can also observe that the highs are around the $2,333 area and the 200-period SMA, while the lows are rising, forming an ascending triangle pattern.
Therefore, our short-term bias is bearish, supported by the 100 and 200-period SMAs, the strong $2,333 resistance level, and two shooting star candlesticks. We also anticipate a larger potential long-term breakout, either up or down, due to decreasing volatility, confirmed by the ascending triangle chart pattern.
If the market fails to break above the 200-period SMA and the $2,333 resistance area with conviction, a potential move down is likely, with the next targets at the $2,312 level, the triangle trendline, and the $2,288 support level.
Alternatively, if there is a premature breakout of the triangle to the upside, momentum could potentially carry the price to the $2,359 and $2,376 levels. However, technical analysis principles and recent history of this pair suggest that volatility may still contract slightly before expanding in the form of a breakout.
Keep an eye on shifting fundamentals and how investors react to uncertainty in the markets with this precious metal.
Summary
- Gold saw a strong rally to $2,450 on May 20th, followed by a sharp decline, sideways movement, and recent downward move.
- Over the past two weeks, the market has gradually pushed higher, touching the 200-period SMA multiple times.
- Key resistance levels are around $2,333 and the 200-period SMA, while lows are rising, forming an ascending triangle pattern.
- Short-term bias is bearish due to moving averages, $2,333 resistance, and shooting star candlesticks.
- A larger breakout, up or down, is anticipated due to decreasing volatility within the ascending triangle.
- Watch for a potential move down towards $2,312, trendline, and $2,288 support if $2,333 resistance holds.


