
Past performance is not indicative of future results. All historical data, including but not limited to returns, volatility, and other performance metrics, should not be construed as a guarantee of future performance.
GBPUSD on a 4-hour timeframe
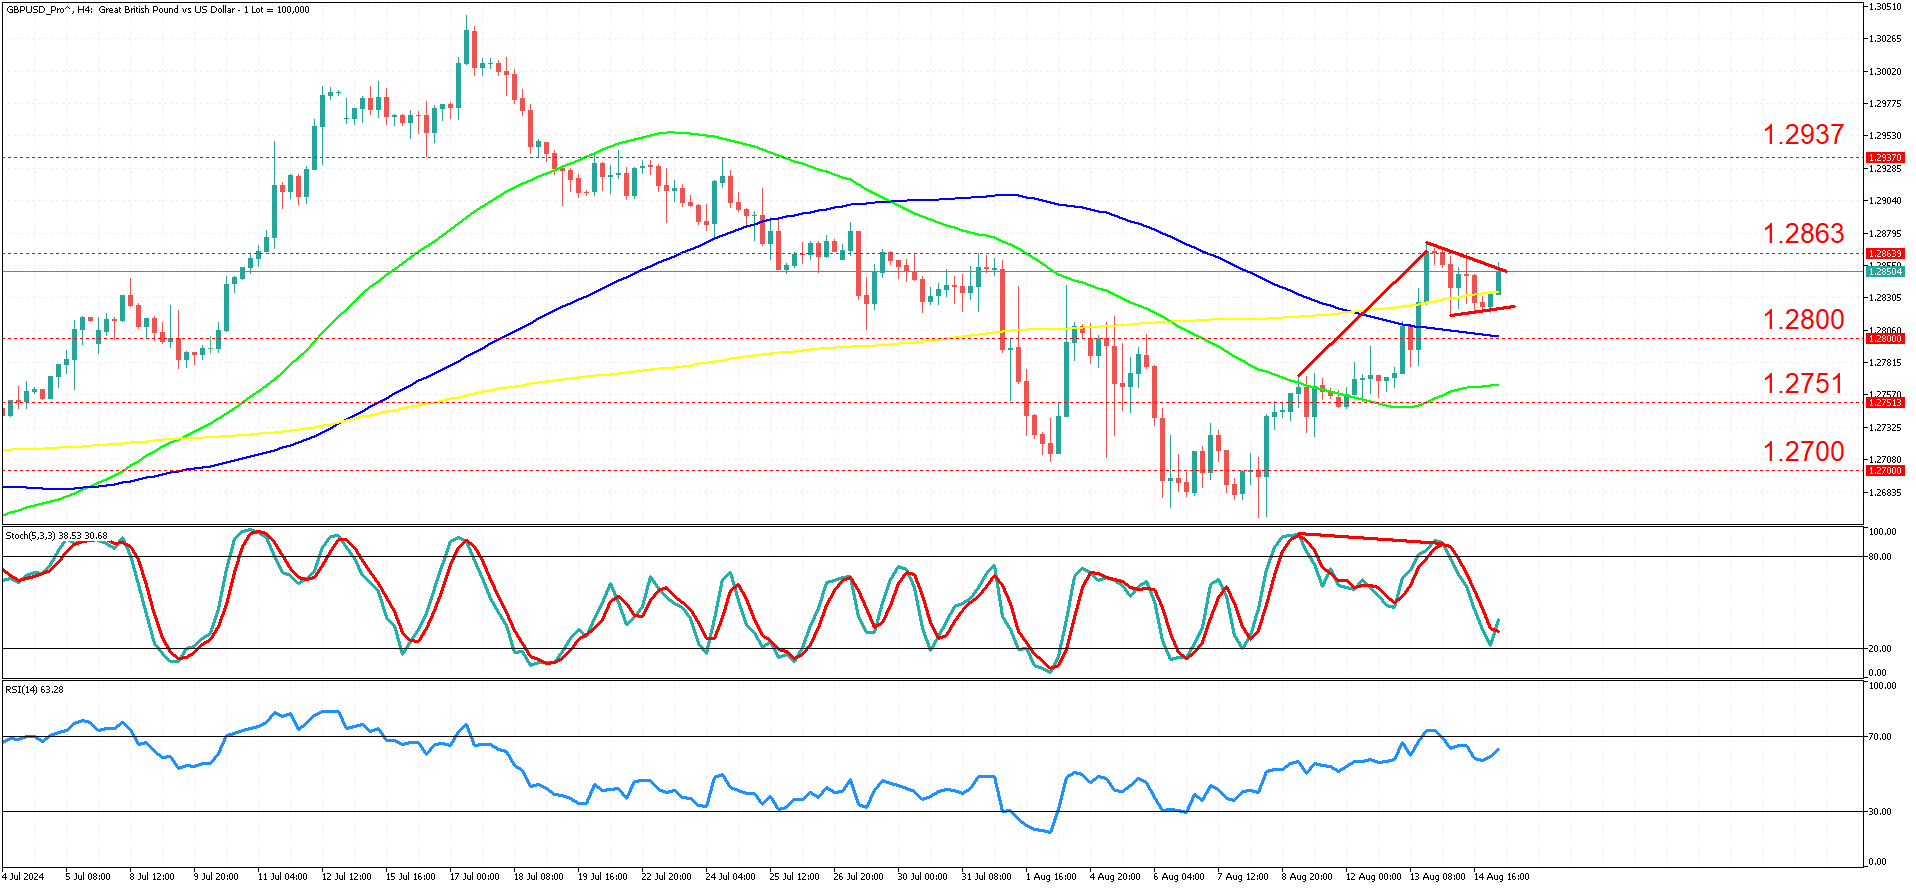
The GBP/USD pair has experienced notable volatility in recent weeks. After a significant rally in mid-July 2024, where the price reached a peak near 1.3130, the pair entered a corrective phase. This downward correction was marked by a series of lower highs and lower lows, which saw the price retreat sharply to a low near 1.2700 by early August 2024. The decline was accompanied by a break below key moving averages, signaling a shift in momentum from bullish to bearish.
In the last few sessions, GBP/USD has shown signs of recovery, bouncing from the 1.2700 area to trade above 1.2800. The price is currently consolidating within a symmetrical triangle pattern, characterized by converging trendlines, which suggests indecision in the market. This might be due to investors waiting for the Retail sales (UK), Building permits and Consumer sentiment (US) releases tomorrow (August 16).
Technical indicators provide mixed signals. The Stochastic oscillator has recently crossed above the oversold level, indicating a potential bullish reversal, but it has not yet entered the overbought territory, leaving room for further upside. This on the back of strong hidden bearish divergence, which adds weight to another potential move down. The RSI (Relative Strength Index) is gradually rising and is currently near the 63 level, which suggests that bullish momentum is building but is not yet overextended. The moving averages, however, are slightly bearish as the 50-period MA remains below the 200-period MA, signaling caution.
The main scenario for GBP/USD is a continuation of the current consolidation within the symmetrical triangle pattern. A decisive breakout above 1.2863 could pave the way for a retest of the 1.2937 level, followed by a potential move towards the psychological 1.3000 mark. This scenario is supported by the gradually improving RSI and the potential for the Stochastic oscillator to enter bullish territory. However, the pair must maintain support above 1.2800 to confirm this bullish outlook.
Alternatively, if the GBP/USD fails to break above 1.2863 and instead breaks below the lower trendline of the triangle, it could signal a return to bearish momentum. In this case, the pair might retest the 1.2751 level, with a further decline possibly extending towards the 1.2700 psychological support. A break below this level would be concerning for bulls, as it could open the door for a deeper correction towards the 1.2700 area.
Investors should remain cautious as the market is currently in a consolidation phase, which often precedes significant moves. The symmetrical triangle pattern indicates a balance between buyers and sellers, but a breakout in either direction could lead to increased volatility and fast paced moves. Upcoming economic data releases and geopolitical developments could act as catalysts for a breakout, so monitor these factors closely. It's important to be aware of potential fake-outs in such patterns, where the price breaks out temporarily but then reverses, hence investors might wait for conviction and confirmation.
Summary:
- GBP/USD has been volatile, rallying to 1.3130 in mid-July 2024 before correcting sharply to 1.2700 by early August 2024.
- The pair is currently consolidating within a symmetrical triangle pattern, suggesting market indecision ahead of key economic data releases.
- Technical indicators provide mixed signals, with the Stochastic oscillator showing potential bullish reversal but hidden bearish divergence also present.
- The main scenario involves continued consolidation, with a breakout above 1.2863 potentially leading to a retest of 1.2937 and possibly 1.3000.
- An alternative bearish scenario could unfold if the pair breaks below the triangle's lower trendline, potentially retesting 1.2751 or even 1.2700.