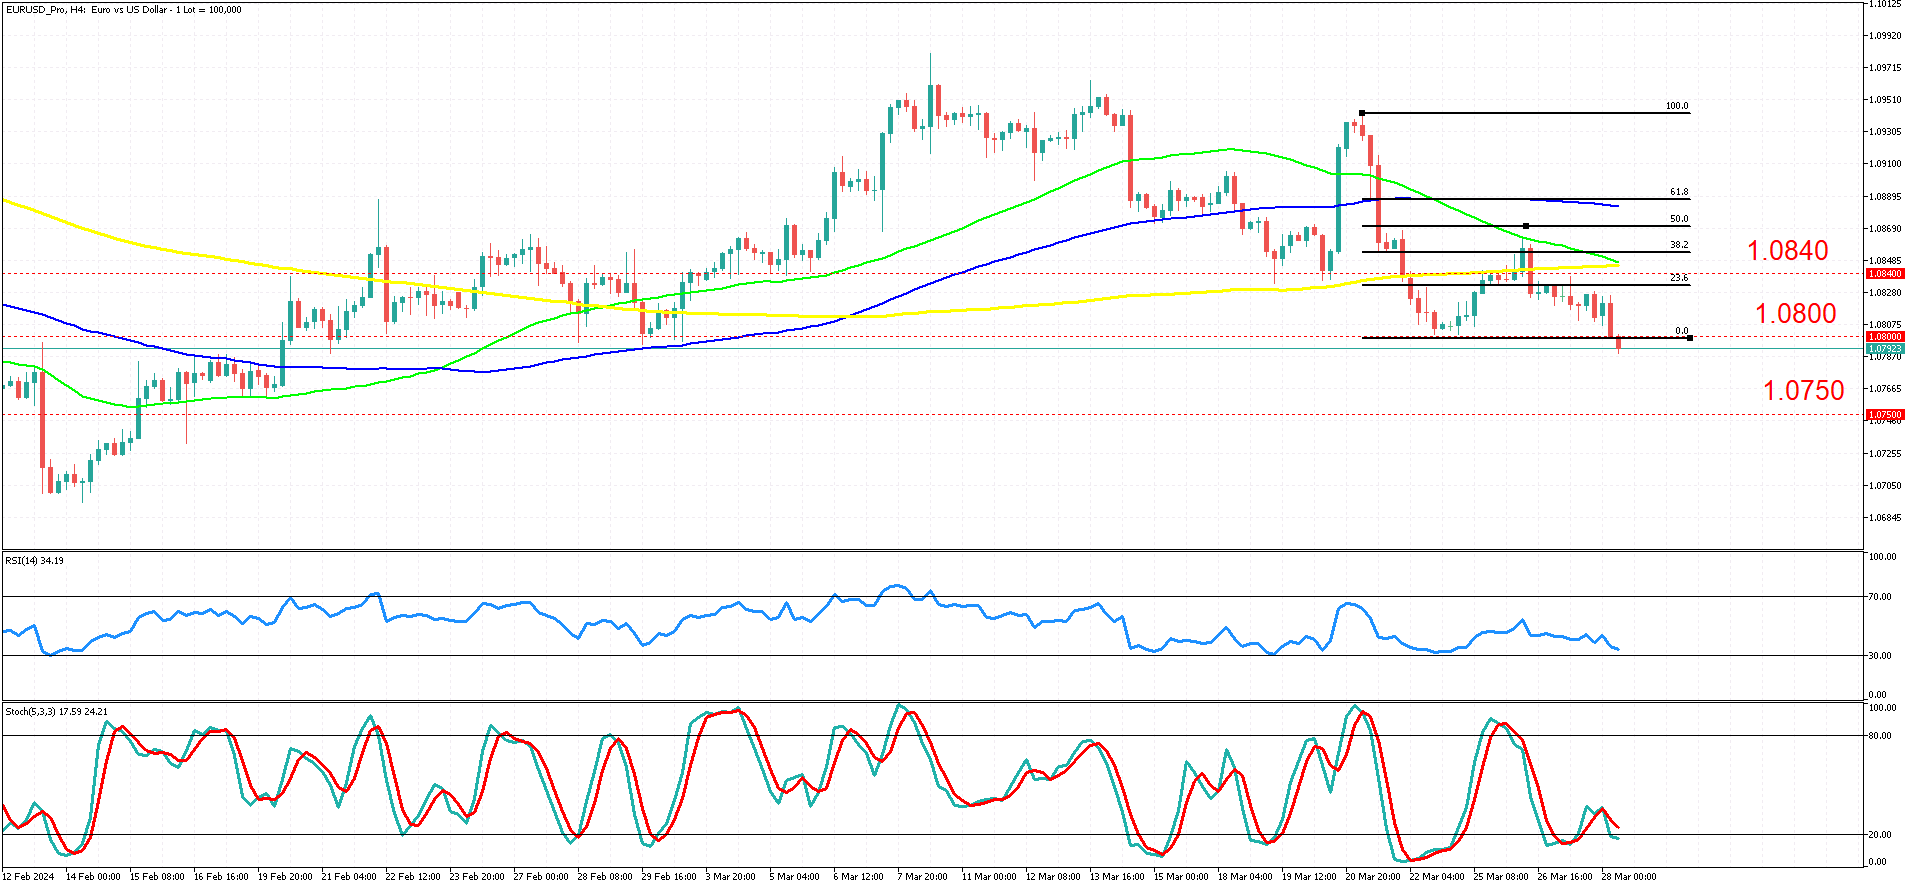
EURUSD 4-Hour Timeframe, 28 March 2024
The EUR/USD currency pair has been following a consistent uptrend on a 4-hour timeframe since it hit a low of 1.0700 on Valentine's Day (14 February). The market then rose to its highest point on 08 March, reaching 1.0980.
However, since then, the bulls have lost control, and the price has been gradually declining. Currently, the pair is at a critical point at 1.0800. The direction of the market in the short term will probably be determined by how it reacts to the psychological level of 1.0800. However, in the long term, the trend has been downward, as evidenced by the moving averages and the decreasing highs and lows in the price movement.
It is important to exercise caution when analyzing technical or fundamental indicators. Although oscillators and news reports may provide valuable insights, ultimately, profit or loss is determined by the market price. One must be careful to read too much into indicators, albeit technical or fundamental. The oscillators can say what they want and the news prints can say what they want, in the end, profit or loss is realized off of price, and in this case, price is moving down.
The question remains whether the price will continue to move downwards or not. We will use candlestick analysis and price action around the 1.0800 level to determine this.
If the price breaks below the level of 1.0800 with conviction, it is possible that the price will continue to move downward and reach the next support level at 1.0750. By conviction, we mean a clean break below the support level. This is usually indicated by a larger than usual candlestick. It's important to note that we don't want to see big candle wicks as this indicates indecision. This downward move can stay in play as long as we don't plot a high above the previous high at 1.08630 or have a shift in sentiment.
If we observe indecisiveness around the significant 1.0800 level, it could suggest that the market is preparing to pause and retrace. The next target for a retracement is back to the 23.6% Fibonacci level. This level coincides with the resistance level at 1.0840. When we talk about indecision, we refer to the absence of a clear direction, sideways movements, and smaller candlesticks with longer wicks than usual.
It is important to note that support and resistance levels are not an exact science but rather an art form. The perceived levels are approximate and not absolute. This is where your experience will guide you in determining whether a level is still intact and signaling a potential reversal or if a level has been breached and signaling momentum continuation.
Keep an eye out for potential macroeconomic factors that can cause a shift in sentiment.
Summary:
- EUR/USD maintained an uptrend until 08 March before gradually declining towards the critical 1.0800 level.
- Long-term bias remains downward, supported by price action and moving averages.
- Short-term direction likely hinges on the reaction at 1.0800.
- A convincing break below 1.0800 may lead to a drop towards 1.0750.
- In case of indecision, targeting the 23.6% Fibonacci retracement level near 1.0840 resistance is a potential strategy.