
Past performance is not indicative of future results. All historical data, including but not limited to returns, volatility, and other performance metrics, should not be construed as a guarantee of future performance.
EURUSD 1-Hour Timeframe
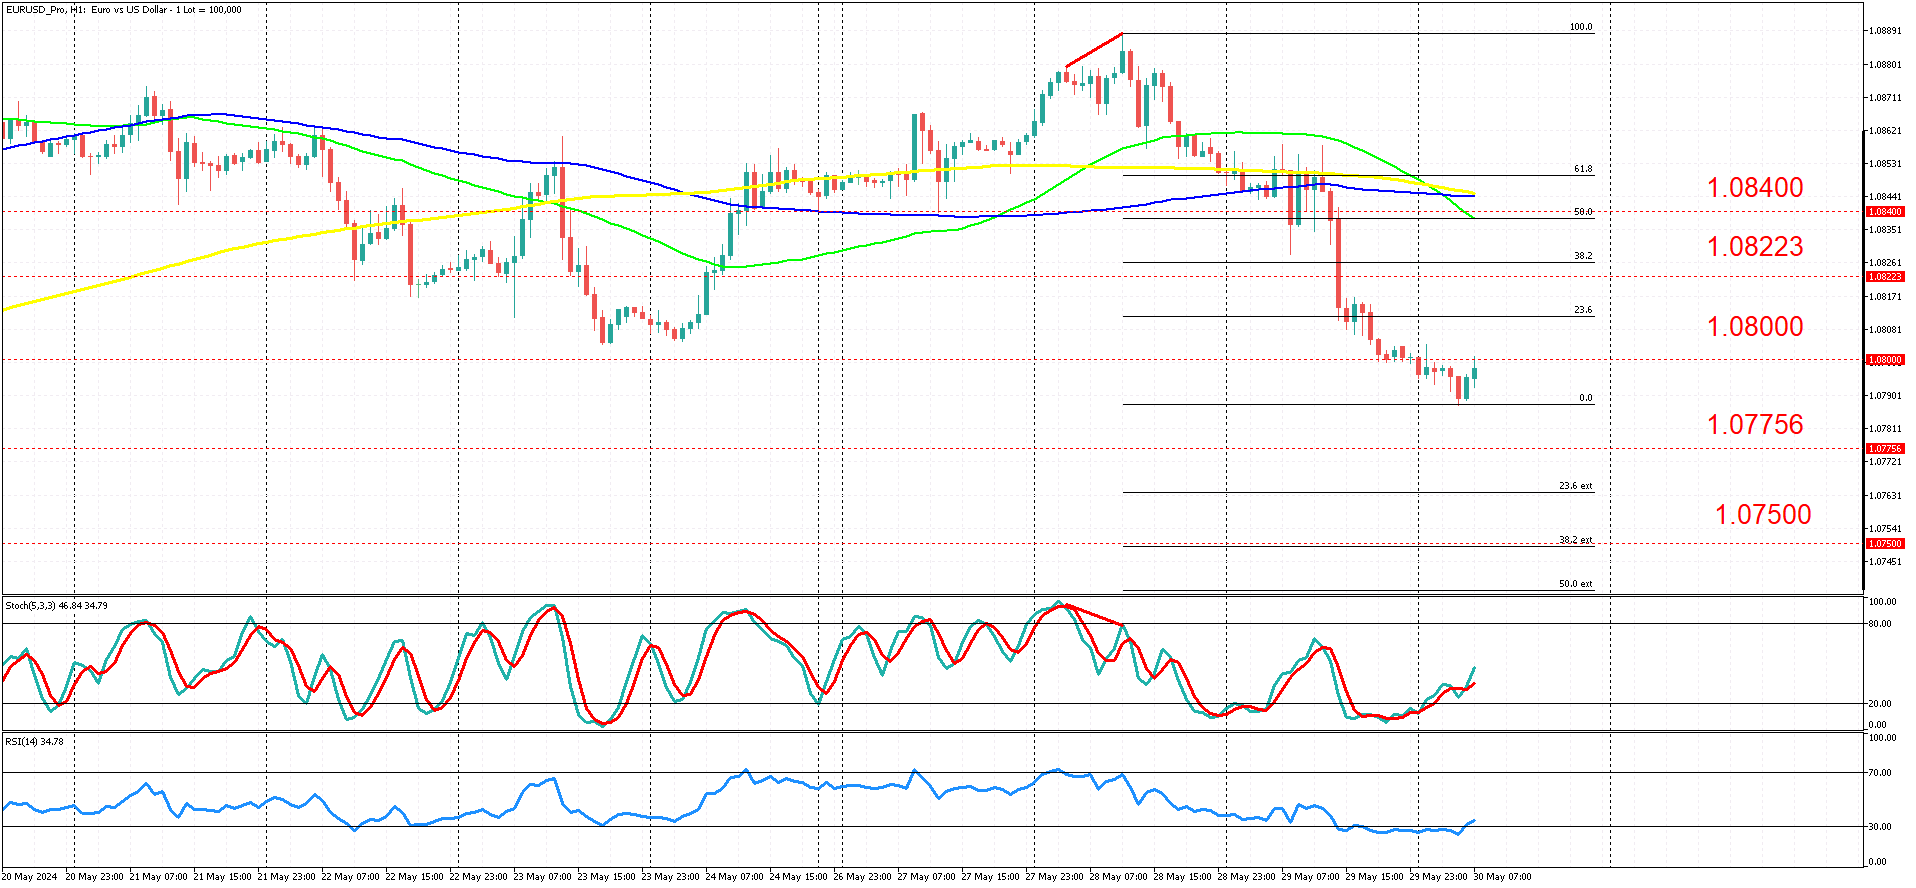
EURUSD on an hourly timeframe experienced a steady six-day decline, reaching a low around the notable 1.08000 level on May 23.
From that point, there was a brief but intense upward push by the bulls, reaching the 1.08886 level. This movement was accompanied by a bearish divergence at the previous highs. Bearish divergence occurs when the price makes higher highs, but the indicator, in this case, the Stochastic oscillator, makes subsequent lower highs. This discrepancy between the oscillator and price action is uncommon and suggests the possibility of a trend change, as seen on the chart.
Following the divergence, the market made a significant downward push, driven by strong fundamental factors. Currently, the market is trading at the 1.08000 level, a strong psychological level for this currency pair.
The overall trend bias is to the downside, confirmed by the moving averages (50, 100, and 200 periods) all indicating a downtrend. We will be looking for continued momentum with potential targets at 1.07756 and 1.07500. These targets remain valid as long as the market stays below the 1.08223 and 1.08400 levels, which are the 38.2 and 50.0 Fibonacci retracement levels.
However, caution is warranted as the market is quite overextended to the downside, making conditions ripe for a possible retracement before potentially continuing down. Seasoned traders often use this situation to enter the trend at better prices (selling at a better price or trading the retracement to the upside). The RSI indicates an oversold condition, being below the 30 threshold for at least 15 candles, which is significant for an oscillator. The Stochastic oscillator has also recently exited the oversold territory without an accompanying retracement.
Two potential scenarios arise for trading. First, one could trade the higher probability of a market retracement to the upside, targeting the 23.6 and 38.2 Fibonacci levels (1.08118 and 1.08265, respectively). Alternatively, one could wait for the retracement to occur and then enter a potential sell trade at a better price, again at the 38.2 and 23.6 retracement levels.
The downside targets remain 1.07756 and 1.07500. Keep an eye out for confirming price action or shifts in investor sentiment.
Summary:
- EURUSD is in an established downtrend following the formation of a bearish divergence and strong fundamentals.
- More favourable potential sell trades are anticipated if the market retraces.
- A retracement will enable better potential entries with smaller stop losses while maintaining the potential targets at 1.07756 and 1.07500.
- Alternatively, if the market trades beyond the 38.2 and 50.0 Fibonacci retracement area, we will look for potential buy trades.