Past performance is not indicative of future results. All historical data, including but not limited to returns, volatility, and other performance metrics, should not be construed as a guarantee of future performance.
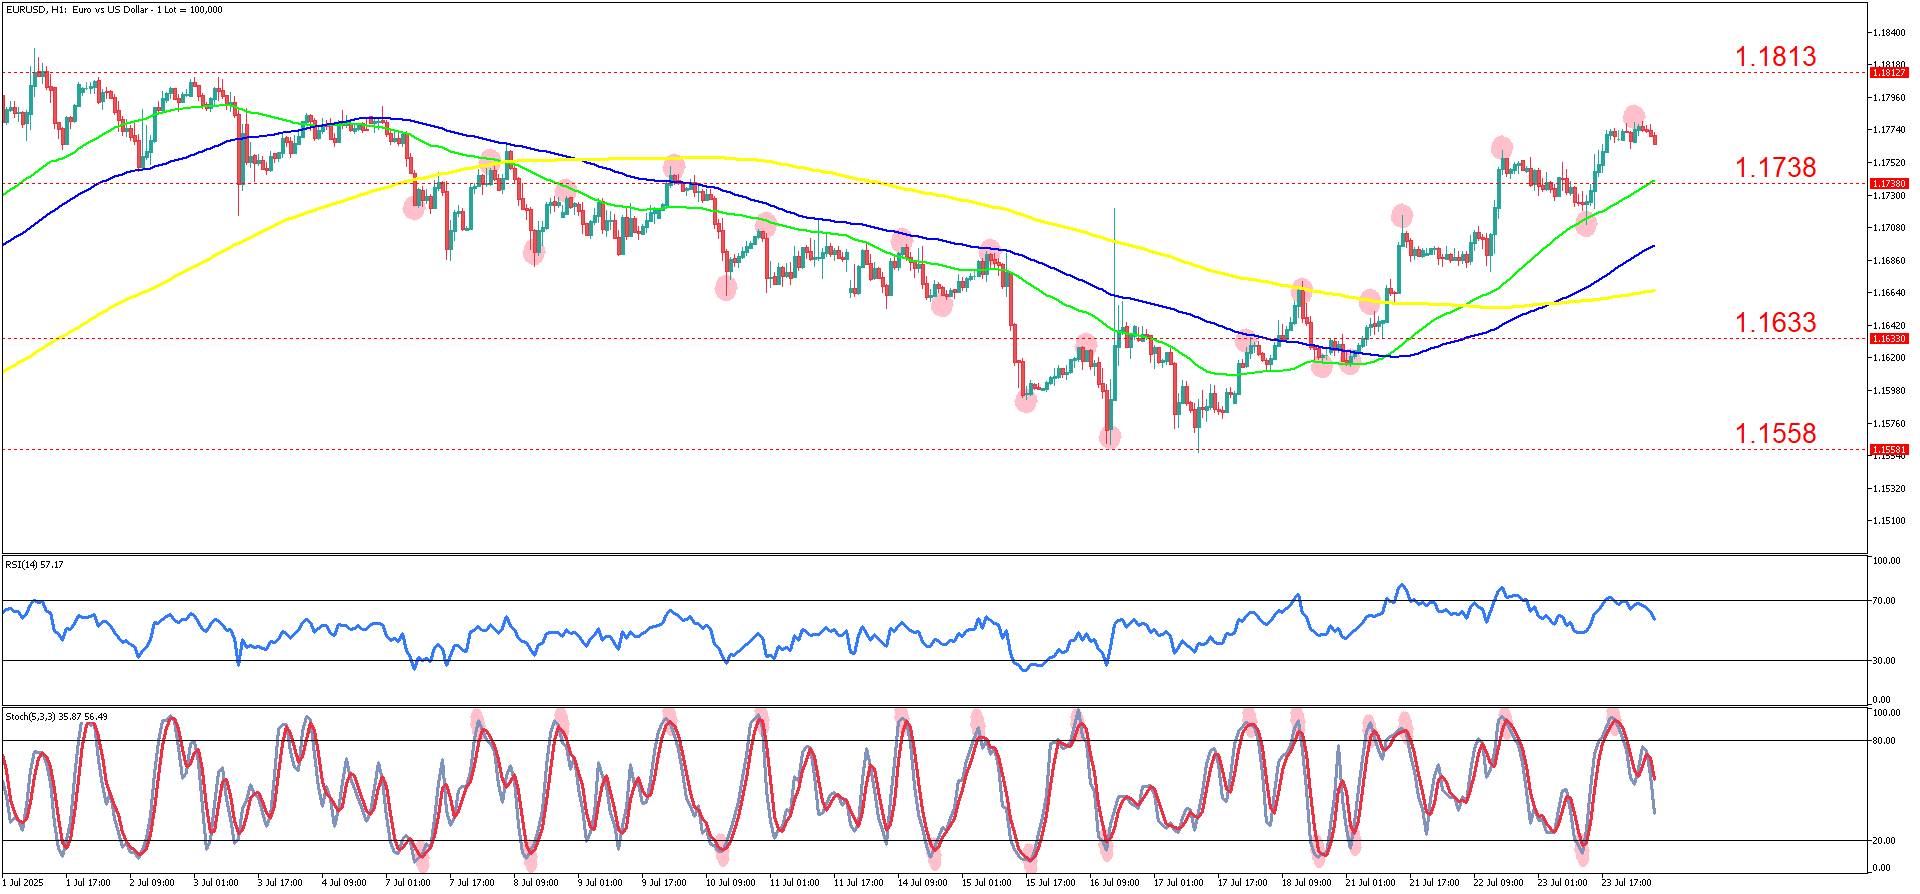
EURUSD on a 1-hour timeframe.
The past technical action shows a prolonged downtrend that dominated the first half of July, with price repeatedly failing to hold above descending moving averages and printing a clear sequence of lower highs and lower lows. Each rally attempt was capped by dynamic resistance from the moving averages, reinforcing the bearish tone until a pronounced bottom formed mid-month.
Recent price action shifted decisively bullish after the mid-July lows near 1.1558, as buyers stepped in and drove a strong impulsive move through 1.1633 and then through the 100-hour and 200-hour moving averages. Price extended toward 1.1780 before stalling and is now consolidating slightly below the 1.1813 resistance, with intraday pullbacks being bought consistently.
Indicators currently show the RSI holding around 57, confirming bullish momentum but leaving room for continuation. The stochastic oscillator, highlighted with red circles, has been particularly effective in signaling overbought and oversold zones in this shorter mean‑reversion market regime, where price repeatedly reverts back to the mean rather than trending strongly. This mean‑reverting behavior is also evident on the chart where pullbacks align closely with the stochastics overbought/oversold turns. The green 50‑period simple moving average has emerged as a key dynamic support and resistance level, now acting as a strong floor during pullbacks in the recent rally.
The main scenario anticipates further upside (with potential for a short term correction first) as long as the 50‑period SMA around 1.1700–1.1720 remains intact. A sustained base above 1.1738 would allow price to retest the 1.1813 resistance, and a breakout beyond that level could open the path toward the 1.1850–1.1880 area, especially with the moving averages aligning bullishly.
An alternative scenario would come into play if price breaks and closes below the 50‑period SMA, which would invalidate the current bullish structure. Such a breakdown could trigger a deeper mean reversion toward 1.1633, and if momentum shifts further bearish, the next logical support would be the prior swing low near 1.1558.
Fundamentally, the past few days have seen EURUSD buoyed by softer U.S. retail sales and dovish Fed comments, while slightly stronger-than-expected Eurozone PMI figures added support to the euro. Looking ahead this week, the ECB meeting minutes, U.S. GDP preliminary data, and updated jobless claims are the key scheduled events that could influence volatility and potentially alter the balance between the current mean‑reverting nature and broader trend development.
SUMMARY:
- Trend Reversal: EUR/USD shifted from a strong early-July downtrend to a bullish breakout after bottoming near 1.1558.
- Technical Breakout: Price surged through 1.1633 and key 100/200-hour MAs, now consolidating just below 1.1813 resistance.
- Momentum Indicators: RSI holds near 57 and the stochastic oscillator aligns with mean-reverting pullbacks, supporting continued upside.
- Key Levels & Scenarios: As long as the 50-period SMA near 1.1700–1.1720 holds, bulls may target 1.1850–1.1880; a break below could shift bias bearish toward 1.1558.