


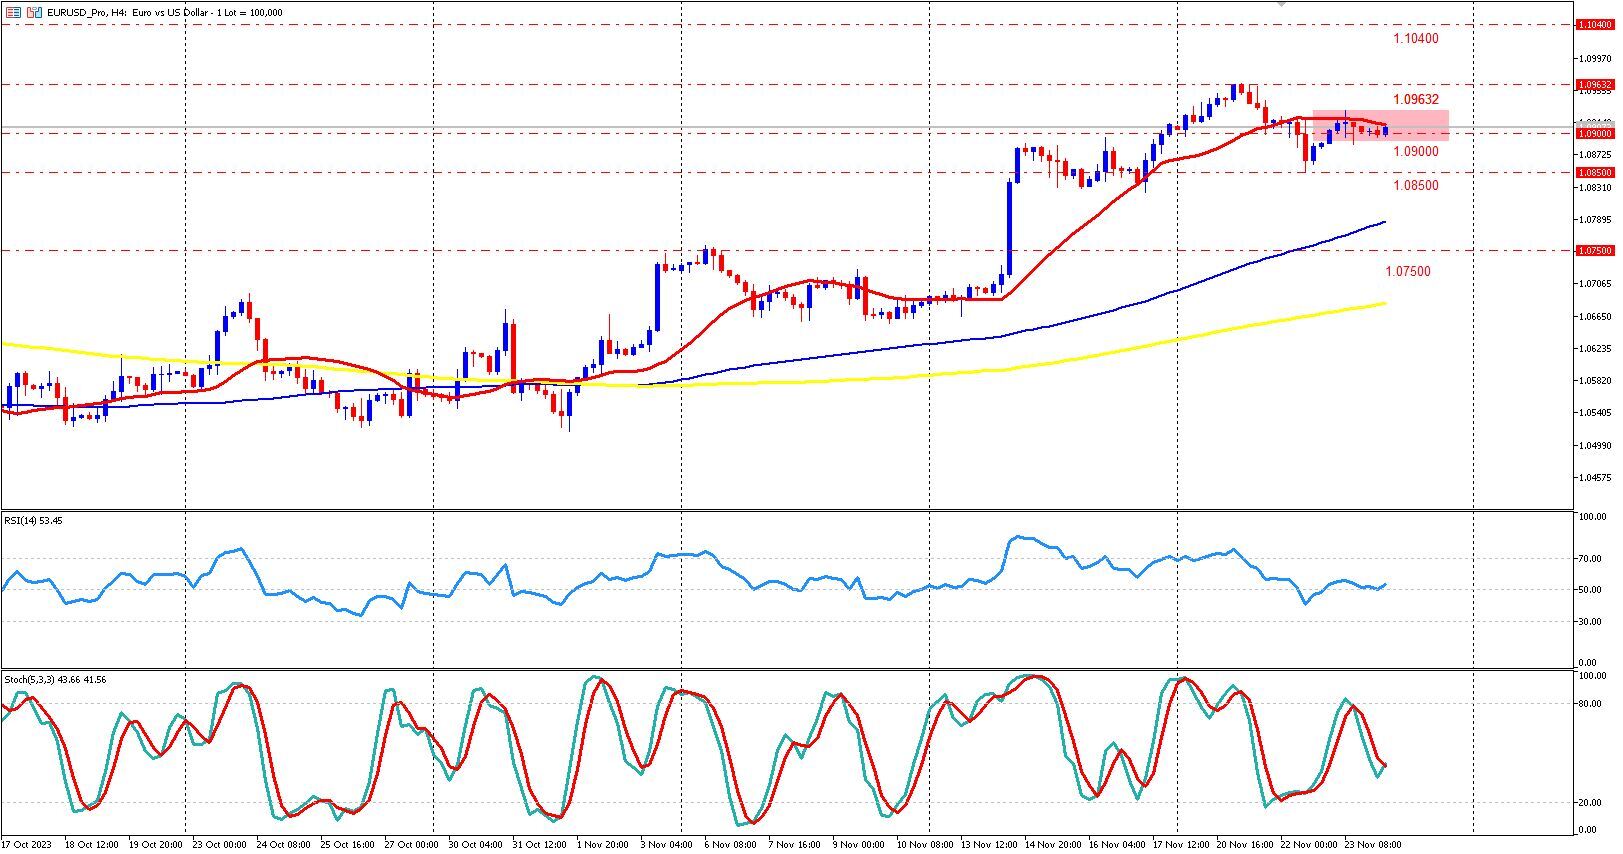
Since October 3, 2023, the EUR/USD pair has exhibited a consistent uptrend on a 4-hour timeframe. This uptrend gained significant momentum around November 3, 2023, propelled by strong news releases such as the Non-Farm Payrolls (NFP), unemployment rate, and ISM Services PMI. This bullish trend was anticipated technically by the crossing of the 20-period simple moving average (SMA) above the 100 and 200-period SMAs, a robust technical indication of a possible bullish move. The EUR/USD pair has been forming higher highs and lows, currently trading around the significant psychological level of 1.0900, which suggests a medium to long-term bullish outlook.
The Relative Strength Index (RSI), consistently remaining above 50, further reinforces this upward trend. The 100 and 200-period moving averages also add weight to this bullish bias.
However, there are indications of a potential short-term downward correction. The EUR/USD recently broke below its 20-period SMA, which is historically a well-respected, dynamic support and resistance. Attempts to reclaim territory above this SMA were unsuccessful, resulting in a doji candlestick formation on the moving average. This, along with an overbought stochastic oscillator, creates an area of confluence that points to a possible bearish correction.
A key factor to watch is a breakout from the current trading range, indicated by a red rectangle on the chart, with a high of 1.09283 and a low of 1.08881. A convincing break below this range could signal a rejection of the crucial 1.0900 psychological level. The initial target in this scenario might be the 1.08500 level, potentially extending to 1.07500 if the bearish trend continues, assuming the fundamental landscape remains unchanged.
Conversely, if the market fails to decisively break below the 1.0900 level, a strong bullish movement could continue. A breakout above the current range might first target the 1.09632 level and potentially extend up to 1.10400.
Summary:
- The EUR/USD is currently in an uptrend but is trading within a range (high of 1.09283 and low of 1.08881).
- A decisive break below this range (and the 1.0900 psychological level) could lead to:
- Target 1: 1.08500
- Target 2: 1.07500
- Conversely, if the 1.0900 level proves too resilient for a bearish breach, a breakout above the range could reach:
- Target 1: 1.09632
- Target 2: 1.10400
- The 100 and 200-period SMA and the RSI indicator favour a move to the upside.
- The 20 Period SMA and the overbought condition on the stochastic oscillator favour a short-term correction to the downside.
- The critical trigger will be a convincing break out of the range.


