


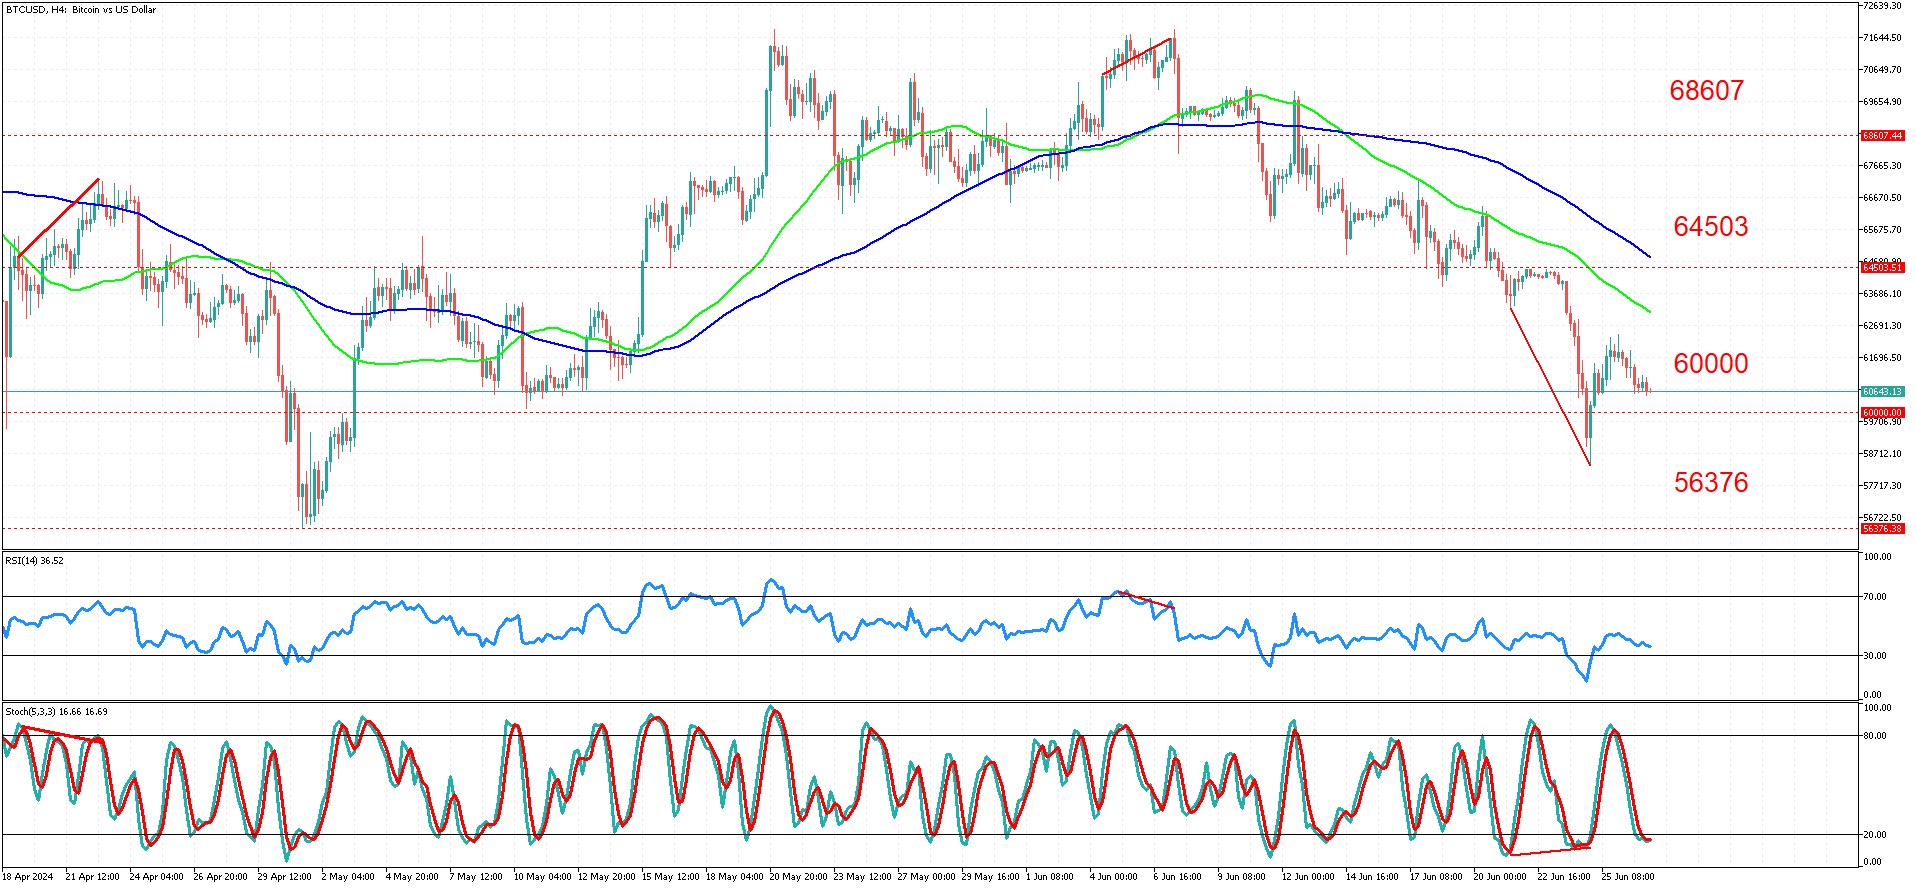
BTC/USD on a 4-hour timeframe
BTC/USD on a 4-hour timeframe reached a high of 72,000 on June 7. This high was marked by a bearish divergence between the price action and the RSI oscillator. Subsequently, the market experienced a rapid, low-volatility decline until it touched and rejected the well-known 60,000 psychological level. This 60,000 level has proven to be a significant area of either resistance or support in this case.
The long-term bias for the chart under study is to the downside, with a clear technical trend in place. This is evident from the continuous lower highs and lower lows on the chart. The moving averages (50-period in green and 100-period in blue) also suggest a prevailing downtrend. Hence, for the longer term, attention is focused on the 56,376 level.
However, markets are not as simple as following two moving averages. As seen on the chart, the bears encountered a roadblock at the 60,000 level, leading to a dramatic reversal once the level was slightly breached.
Examining the bullish divergence that formed right on top of the 60,000 level, the market hints at a possible correction to the upside in the near term. If the market manages to stay above the 60,000 level, we might see prices touch the moving averages and perhaps even the 64,503 resistance level.
Alternatively, if the bears manage to consistently drive prices below the 60,000 barrier, we might see prices fall as far as the 56,376 level or even the 53,000 level.
Bitcoin has been a mysterious risk-on and risk-off asset, with some investors utilizing it as a growth vehicle during times of optimism, while others use Bitcoin as a hedging vehicle during uncertain times. Nonetheless, this unique and fascinating asset should be approached with caution, paying attention to the technical, fundamental, and overall market sentiment.
Summary
- BTC/USD encountered a bearish divergence on the 4-hour chart, indicating potential upcoming volatility.
- The 60,000 psychological level has proven crucial, acting as both resistance and support during recent market movements.
- Long-term technical indicators, including lower highs and lows, suggest a prevailing downtrend bias.
- Bullish momentum could emerge if BTC/USD maintains above 60,000, targeting resistance levels near 64,503.
- Conversely, sustained bearish pressure may push prices towards key support levels at 56,376 or even 53,000.


