


Past performance is not indicative of future results. All historical data, including but not limited to returns, volatility, and other performance metrics, should not be construed as a guarantee of future performance.
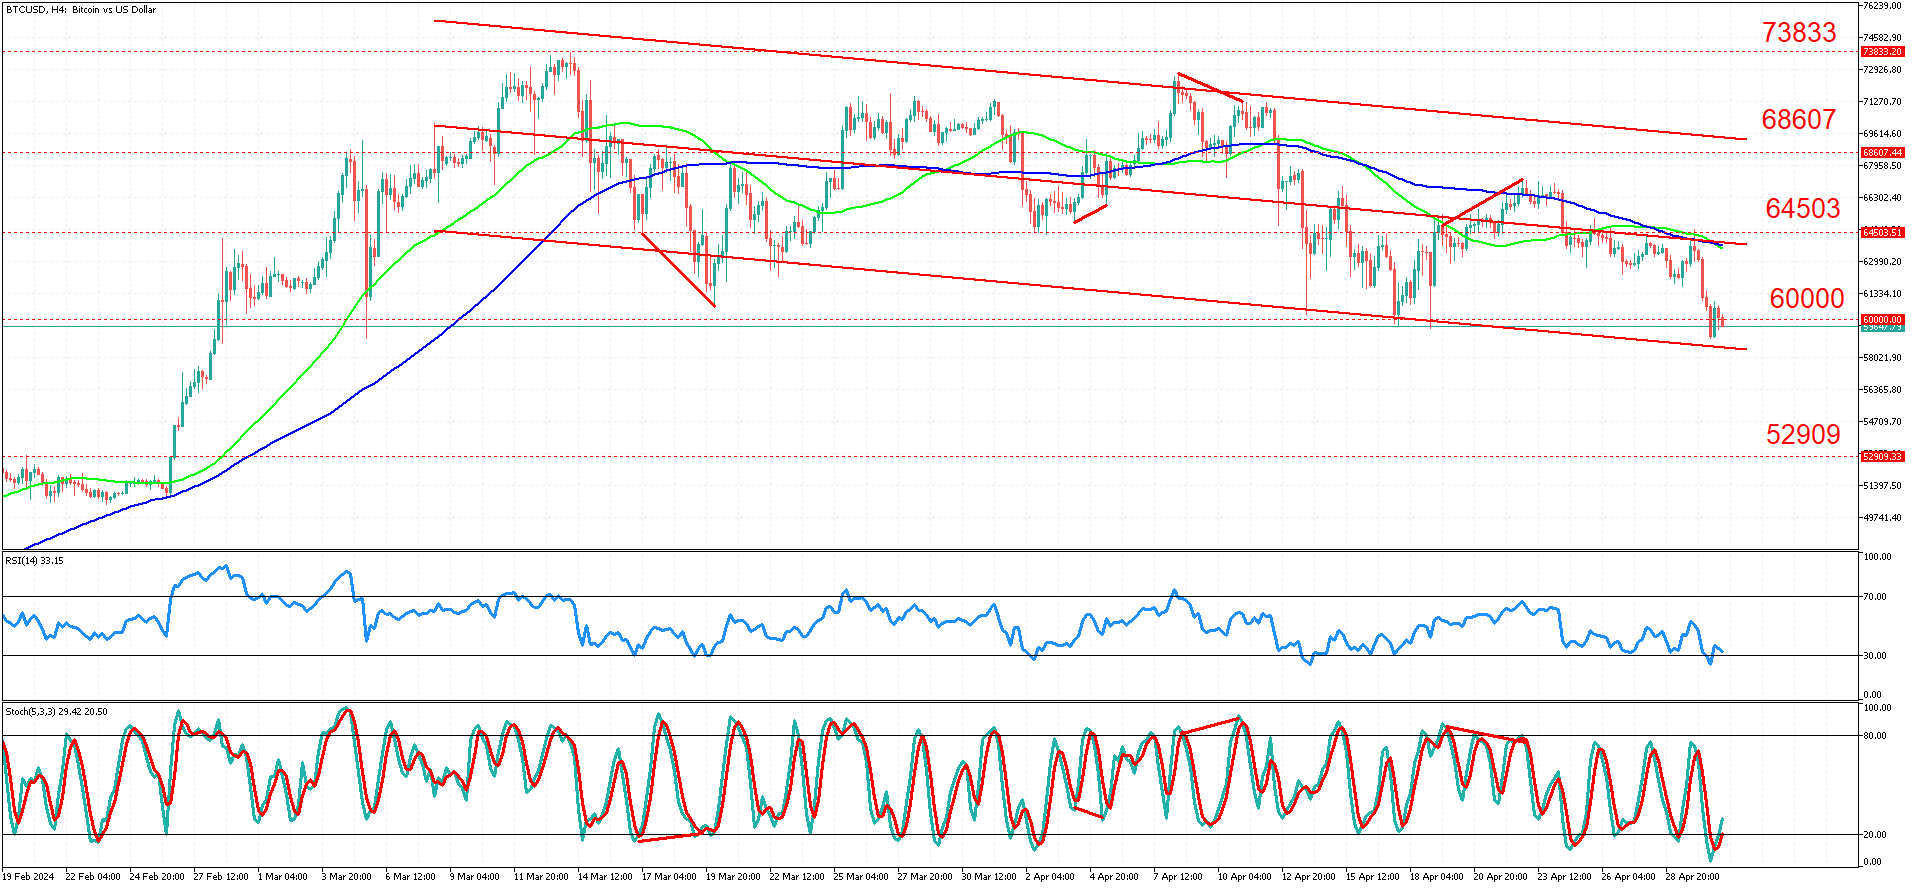
BTCUSD 4-Hour timeframe
Bitcoin, the most popular cryptocurrency, has recently experienced significant price fluctuations. After reaching an all-time high, Bitcoin's price began to decline, forming a pattern of lower highs and lower lows — a classic sign of bearish momentum.
Within the downward-sloping channel, there have been numerous instances of both hidden and classic divergence, after which the price typically reverted back to the mean. Ideally, one would wait for divergence to form at extremes—a reasonable distance from the middle line of the channel — for added confirmation.
Currently, Bitcoin is trading at the lower trend line of a downward-sloping channel, with both the Stochastic and RSI indicators recently signaling oversold conditions. A significant milestone for Bitcoin's chart was reaching the $60,000 level, a crucial and well-respected psychological barrier.
The primary assumption is that this level will be rejected, leading to a short-term return to the mean. Therefore, potential profit targets could be either the middle line of the channel, which is also near the 50 and 100-period simple moving averages, or the next resistance level at $64,503.
Alternatively, if the price falls below the critical $60,000 level, it could lead to a significant drop. This may be due to a break in the market's structure, which could result in strong bearish momentum as buyers' stop losses are triggered. This would add more downward pressure on the price, potentially causing it to fall as far as the $52,909 level.
Since Bitcoin is closely correlated with other stock indices, and the global sentiment is on the cautious side, one must keep an eye out for investor sentiment.
Summary:
- Bitcoin reached an all-time high of $73,833, showing strong upward momentum.
- Subsequently, it entered a high-volatility downward-sloping channel.
- Prices are currently near the lower boundary of this channel.
- Both Stochastic and RSI indicators have signaled oversold conditions.
- Bitcoin is at the critical psychological level of $60,000.
- It's crucial to monitor any shifts in market sentiment going forward.


