


Past performance is not indicative of future results. All historical data, including but not limited to returns, volatility, and other performance metrics, should not be construed as a guarantee of future performance.
USDJPY on a 1-hour timeframe
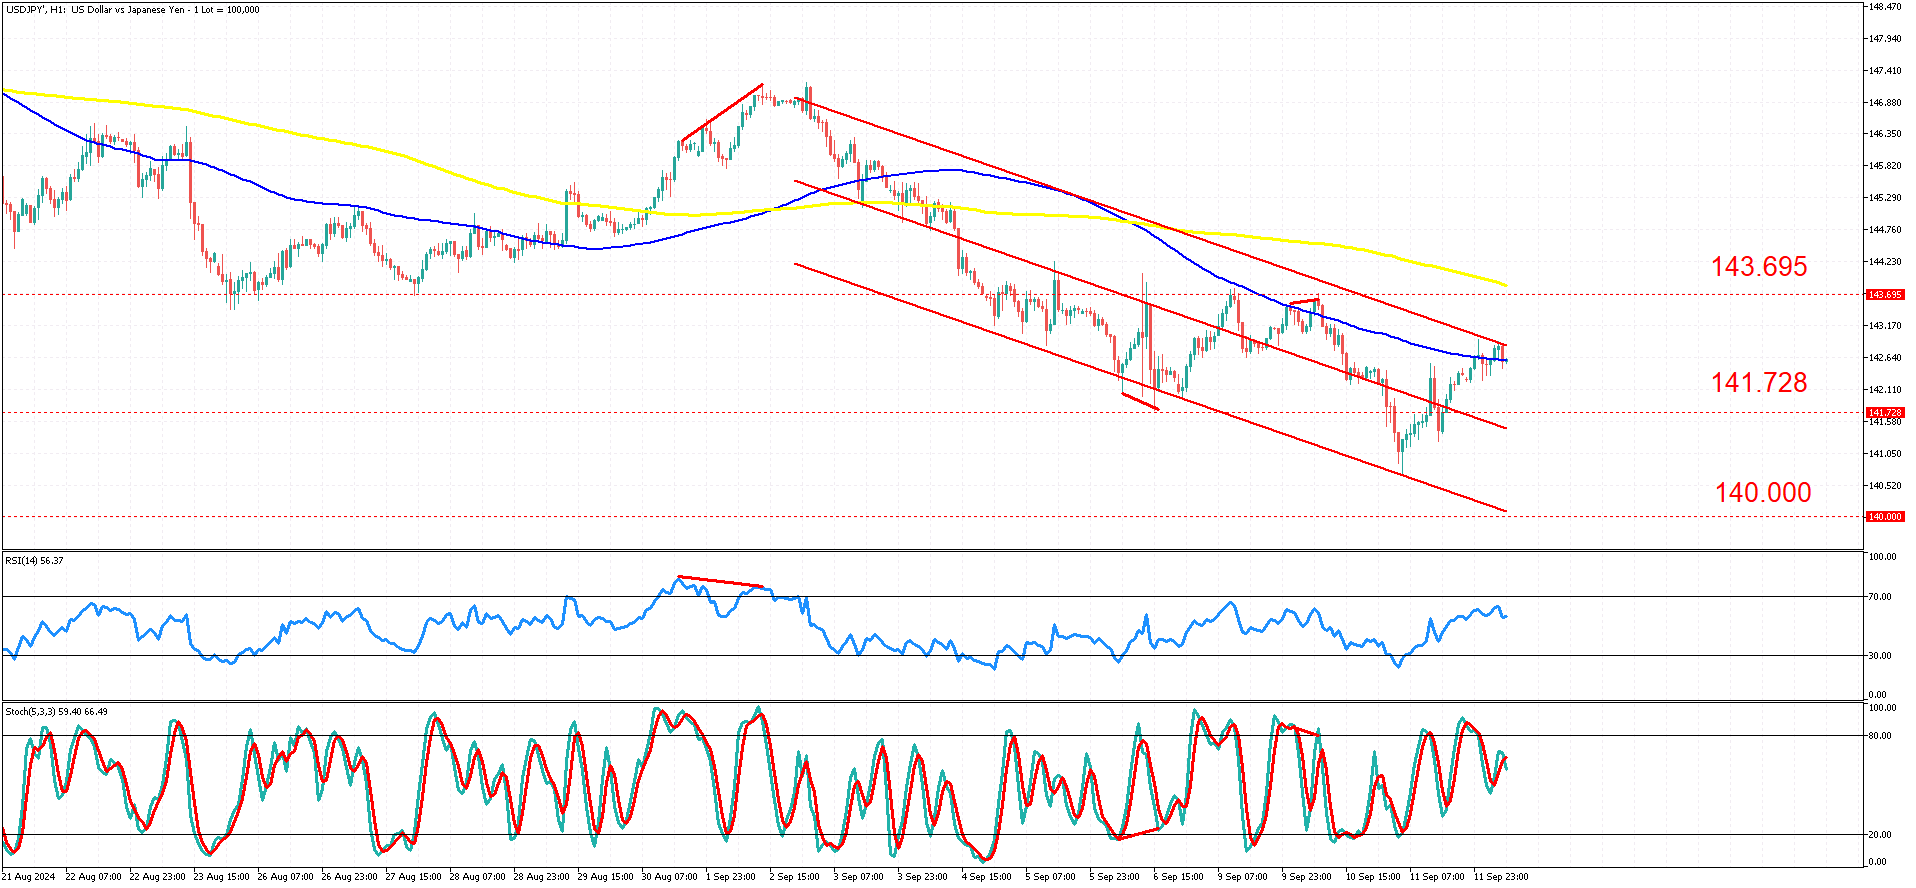
$USDJPY on a 1-hour timeframe reveals a descending trajectory within a defined bearish channel since late August 2024. The currency pair experienced a rebound from the lower channel boundary and is now confronting resistance at the 100-period simple moving average (SMA) depicted in blue, alongside the upper channel limit. Key resistance is marked at 143.695, with immediate support at 141.728 and further support at the psychological level of 140.000. Notably, the RSI (14) indicates a bearish divergence as the price peaked on August 30 with a higher high while the RSI recorded a lower high, suggesting weakening momentum that suggested reversal.
Recently, the price rebounded from the 140.000 support level and has tested the 141.728 resistance several times, indicating an ongoing consolidation. Short-term price actions suggest an attempt by buyers to advance higher, yet the bearish channel's upper boundary currently being tested at 143.695 remains a critical pivot for the near-term price direction.
Technical indicators present mixed signals; the RSI is neutral at 56.37, leaning slightly bullish but with the earlier noted divergence cautioning of potential declines. The Stochastic oscillator points upwards at 59.40, approaching overbought conditions, which could hint at a nearing pullback.
The primary scenario anticipates a continuation of the bearish trend, with prices adhering to the descending channel. Should the pair fail to surpass the 143.695 resistance decisively, it could trigger a renewed selling interest, possibly driving the price back down toward 141.728 and potentially retesting the 140.000 support level if the bearish signals hold.
Conversely, a bullish breakout above 143.695 could invalidate the bearish channel pattern. A clear move past this resistance, especially if supported by increasing trading volumes, might lead to further upward movements towards 144.500 or even 145.000, as buyers capitalize on any shifts in market sentiment favoring the dollar against the yen.
Investors should remain vigilant of global uncertainties and risk-on risk-off events, which heavily influence the USD/JPY pair. Fluctuations in global risk appetite can lead to significant moves in this pair, as the yen is often seen as a safe-haven asset during times of market stress. Monitoring these dynamics closely will be crucial for traders looking to navigate the potential swings in the currency markets effectively.
Summary:
- USD/JPY is trading within a bearish channel since late August 2024.
- The pair faces resistance at 143.695, with support at 141.728 and 140.000.
- RSI shows a bearish divergence, suggesting weakening momentum.
- A failure to break 143.695 may trigger a bearish reversal.
- A bullish breakout above 143.695 could signal further upward movement.


