


Past performance is not indicative of future results. All historical data, including but not limited to returns, volatility, and other performance metrics, should not be construed as a guarantee of future performance.
AUD/USD on a 4-Hour Timeframe
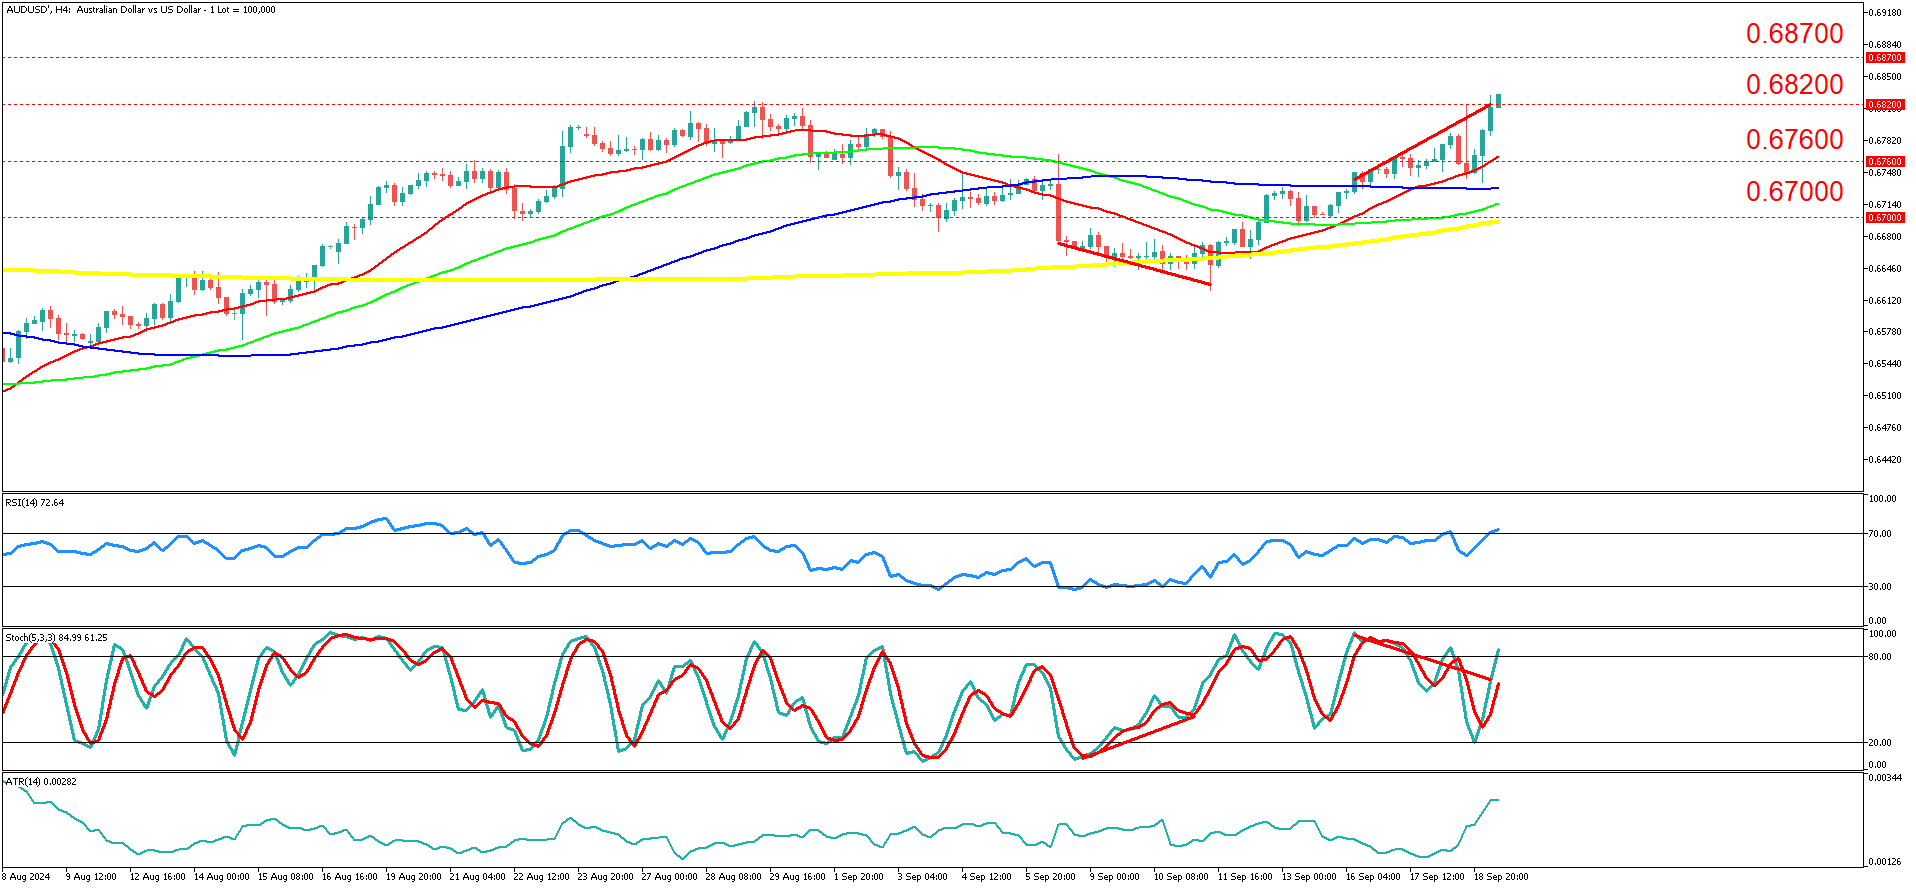
AUDUSD on a 4-hour timeframe exhibited a strong upward trend after a corrective move and bullish divergence, as seen in the mid-September period. The price action demonstrates a consistent recovery from the 0.6600 region, establishing a series of higher highs and higher lows. Moving averages, particularly the 50, 100, and 200-period EMAs, are showing a bullish alignment with the 50 EMA crossing above the 100 EMA and now approaching the 200 EMA. The price is currently testing the 0.6760 resistance level, having already surpassed key psychological levels.
Recent price action reflects strong bullish momentum, with the pair making sharp gains after the consolidation between 0.6650 and 0.6700. This move aligns with global macroeconomic shifts, especially the combination of stronger-than-expected Australian employment data and expectations that the Reserve Bank of Australia (RBA) will hold off on further rate cuts. At the same time, the Federal Reserve’s decision to implement a 50-basis-point rate cut has led to US Dollar weakness, providing further support for AUD/USD gains.
Technical indicators underscore the bullish momentum. The Relative Strength Index (RSI) is trading above 70, indicating overbought conditions, though this suggests the uptrend could continue before any significant pullback. The stochastic oscillator is similarly elevated, signaling that the pair may remain in a bullish zone in the short term. Average True Range (ATR) values show a slight increase in volatility, suggesting that price action may remain active around key resistance levels.
The main scenario points to continued bullish momentum, with price likely to break above 0.6820 and test the next resistance at 0.6870. Given the supportive macroeconomic backdrop — highlighted by strong Australian employment and limited prospects for RBA rate cuts — further appreciation is plausible. Additionally, the weakening US Dollar, driven by the Fed’s dovish stance, will likely add to the upward pressure on the pair.
An alternative scenario could emerge if the price fails to hold above 0.6760, potentially leading to a short-term retracement toward the 0.6700 support. In this case, a pullback could be prompted by profit-taking or renewed concerns regarding global risk sentiment. However, with the broader economic outlook favoring AUD strength and US Dollar weakness, any such move would likely be corrective rather than a trend reversal.
Investors should remain cautious of potential volatility, especially around upcoming economic events such as further statements from the RBA or unexpected data releases from the US that could alter interest rate expectations. Moreover, although the RSI and stochastic suggest overbought conditions, the fundamental backdrop provides ample support for continued bullish action in AUD/USD, warranting a watchful approach for any signs of exhaustion or correction.
Summary:
- AUD/USD shows a strong upward trend on the 4-hour chart.
- Moving averages indicate bullish momentum with the 50 EMA crossing above the 100 EMA.
- The pair is currently testing the 0.6760 resistance level.
- Strong Australian data and a weaker USD drive the rally.
- RSI and stochastic show overbought conditions supporting the bullish trend.
- The main scenario points to a rise toward 0.6820 with a pullback possible if 0.6760 fails.


