The hammer candlestick pattern is commonly observed in the forex, futures and stock markets, providing valuable insights into trend reversals. Traders need to understand that the hammer candle is more than just a visual element on a chart; key factors validating this pattern include price movement and its placement relative to the current trend.
Recognizing potential reversals can help technical traders to spot trading opportunities. The hammer candlestick pattern is one such indicator that can help identify emerging trends.
Hammer Candlestick Pattern - How to Use this Guide
- To get the most out of this guide, it’s recommended to practice putting these Hammer candle trading strategies into action.
- The best risk-free way to test these strategies is with a demo account, which gives you access to our trading platform and $10,000 in virtual funds for you to practice with.
- Once you’ve found a strategy that you feel confident about, you may want to upgrade to a fully funded live account where you can apply your newfound edge.
- Alternatively, copy the moves of top-performing traders in real time with NAGA Autocopy.
What is a Hammer Candlestick Pattern?
A hammer candlestick is a price pattern in candlestick charting that appears when an asset opens much lower than it trades but then rallies during the trading period to close near the opening price. A hammer should have a "T"-like appearance, suggesting a potential reversal.
This Japanese candlestick pattern with a hammer shape is characterized by a lower shadow at least twice the size of the real body. The shadow represents the high and low prices for the period, while the body shows the difference between the opening and closing prices.
A hammer occurs when an asset's price has been falling, indicating that the market might be finding a bottom. Hammers suggest that sellers may be giving up, creating a potential bottom, while the price increase indicates a possible change in direction. This happens within a single period (candlestick), where the price drops after opening but then rises to close near the opening value.
However, a hammer candlestick does not guarantee an upward reversal. Confirmation occurs if the candle that follows closes above the hammer's closing price, ideally indicating strong buying. Traders often enter long positions or exit short positions during or after the confirmation candle. A stop loss might be placed below the hammer's shadow for new long positions.

Hammers are rarely used alone, even with confirmation. Traders usually use technical indicators, price analysis, or trend analysis to further validate candlestick patterns.
Hammer events can occur in all time periods, including one-minute, daily, and weekly charts patterns.
Underlying Psychology of the Hammer Candlestick
The hammer candlestick pattern reveals important market psychology through two types: the bullish hammer and the inverted hammer. The bullish hammer, found at the end of a downtrend, has a short body with a long lower wick, indicating potential reversal.
Conversely, the inverted hammer has a long upper shadow with the open, close, and low prices near the same level, suggesting a possible bullish reversal despite initial selling pressure.
Bullish Hammer Candlestick Formation

You can identify a hammer candlestick by its long lower wick and relatively short body, with little to no upper wick. The body should be two to three times shorter than the lower wick. This pattern indicates that the market reached a new low during the session but then rebounded and closed much higher. This suggests significant selling pressure initially, followed by buyers stepping in to counter the bears before the close.
While bearish sentiment is weakening, it doesn't necessarily indicate an imminent reversal. Therefore, most technical traders wait for confirmation before opening a position on a hammer—typically a strong upward move in the next period.
Inverted Hammer Candlestick Formation

An inverted hammer candlestick looks like a hammer turned upside down. It indicates initial buying pressure, followed by selling pressure that isn't strong enough to drive the market price down significantly. This pattern suggests that buyers may soon take control of the market. Identifying an inverted hammer involves looking for a long upper wick, a short lower wick, and a small body.
The inverted hammer forms when bullish traders gain confidence, pushing the price up as far as possible, while bears attempt to resist. Despite this selling pressure, the bullish trend prevails, and the market settles at a higher price. Often appearing at the bottom of a downtrend, the inverted hammer signals a potential bullish reversal, indicating that buyers are becoming stronger and may soon dominate the market.
How to trade Hammer candlesticks
If you wish to trade after spotting a hammer candlestick pattern, you can use derivatives like CFDs. With derivatives, you can trade both rising and falling prices. Therefore, you can open a long or short position based on your prediction of the asset's price movement when a hammer pattern appears.
Follow these steps to trade hammer candlestick chart pattern:
Determine the Hammer's identity: Look for a candlestick with the attributes mentioned above. If this pattern appears after a downtrend, it holds greater significance. Confirmation & Entry Point: Wait for the next candlestick to confirm the reversal, such as a long bullish candlestick or a gap-up. Enter the trade at the start of the following period after the confirmation candle. Stop Loss: To protect your investment, place a stop loss below the Hammer candlestick's lowest point. Profit Target: Set your profit target according to your trading plan. A common strategy is to aim for a price that is twice the stop loss.
Two trading strategies with Hammer Candlestick
Below we explore various hammer candle strategies that can be applied to trading.
Trading Hammer pattern with Stochastic indicator
The chart below for EUR/USD shows the appearance of a hammer candle at the bottom of the current downtrend. The hammer pattern indicates that buyers are starting to take control and the trend could reverse to the upside. At this point, it is important to note that traders should look for supportive signals indicating that the trend may reverse before executing a trade.
The chart below uses the Stochastic indicator, which shows that the market is currently in the oversold zone - increasing the bullish bias.
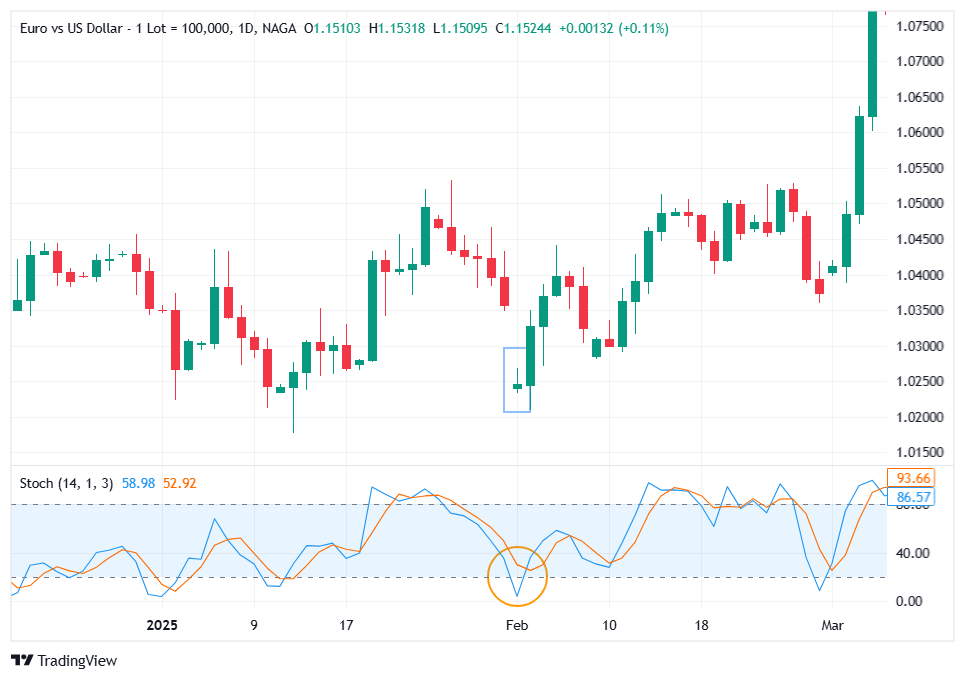
For illustrative purposes only. Past performance is not indicative of future results.
Trading Hammer Pattern with Moving averages
Moving averages are ideal classic for technical traders seeking medium-term trades, as their crossovers provide insight into upcoming trends. When the short-term moving average crosses above the long-term moving average, it generates a bullish signal.
In the chart below for the NZD/USD pair, the short-term moving average crossing above the longer moving averages indicates an uptrend. The formation of the hammer pattern further clarified this signal, pushing the pair higher.
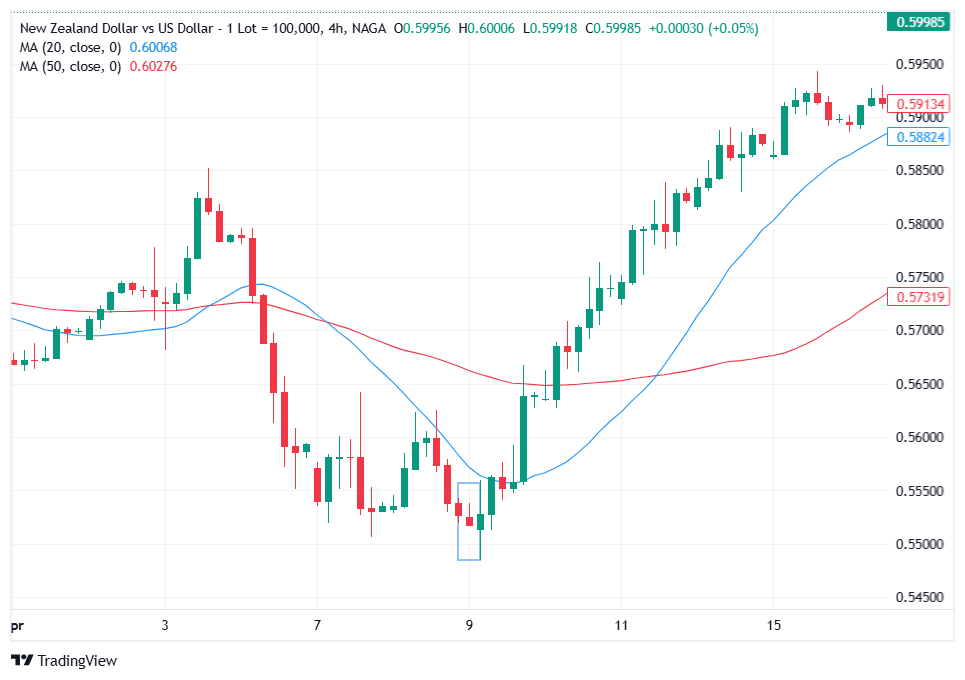
For illustrative purposes only. Past performance is not indicative of future results.
Advantages and disadvantages of hammer pattern candle
Since hammer candles have advantages and disadvantages, traders should avoid entering a trade immediately after spotting a hammer candle. Or unless it is as a trend confirmation signal.
Advantages & disadvantages
Advantages Disadvantages Reversal Signal: The pattern suggests that lower prices are being rejected. In a downtrend, it may indicate that selling pressure is ending and the market is about to stabilize or move upward.
Exit Signal: As selling pressure diminishes, traders with open short positions can interpret the hammer candle as an indication that it is time to exit the position.
Lack of Trend Indication: Interpreted in isolation, the hammer candle might provide a misleading signal because it does not account for the overall trend.
Supporting Evidence: Traders should seek additional chart data to confirm a reversal. Look for significant support levels, pivot points, key Fibonacci levels, or overbought signals from indicators like the CCI, RSI, or stochastic.
Where to trade hammer candlestick chart pattern:
To get started trading hammer candlesticks, open an account. Choose between a live account to trade CFDs straight away or practice first on our demo account with virtual funds. Choose your financial instrument. hammer candles can be spotted in most financial markets, especially those that are more volatile, such as forex, cryptocurrencies, and stocks. Explore our online trading platform. We offer multiple chart types that are not limited to candlestick charts, as well as providing a range of order execution tools for fast trading, which in turn helps you to manage risk.
Final notes about Hammer Candlestick
A hammer candlestick pattern forms when a financial asset opens significantly lower than its opening price but then climbs to close near the opening price. This pattern is characterized by a lower shadow at least twice the size of the actual body. It indicates that buyers regained control after sellers initially drove the price down, suggesting a potential upward price reversal.
Bullish reversal patterns like the hammer and inverted hammer appear at the end of a downtrend, signaling that the bears are losing strength. These patterns reflect market sentiment and suggest an impending trend reversal. However, it is essential to confirm these signals with additional technical indicators to ensure a high probability of success.
Free resources
Remember, you should have some trading experience and knowledge before you decide to trade with hammer candlestick pattern, you should consider using the educational resources we offer like NAGA Academy or a demo trading account. NAGA Academy has lots of free trading courses for you to choose from, and they all tackle a different financial concept or process – like the basics of analyses – to help you to become a better trader or make more-informed investment decisions.
Our demo account is a suitable place for you to get an intimate understanding of how trading and investing work – as well as what it’s like to trade with leverage – before risking real capital. For this reason, a demo account with us is a great tool for investors who are looking to make a transition to leveraged securities.
Sources:
- https://candlecharts.com/
- https://www.cfainstitute.org/en/membership/professional-development/refresher-readings/technical-analysis
- https://www.cmegroup.com/education/courses/technical-analysis/chart-types-candlestick-line-bar.html