


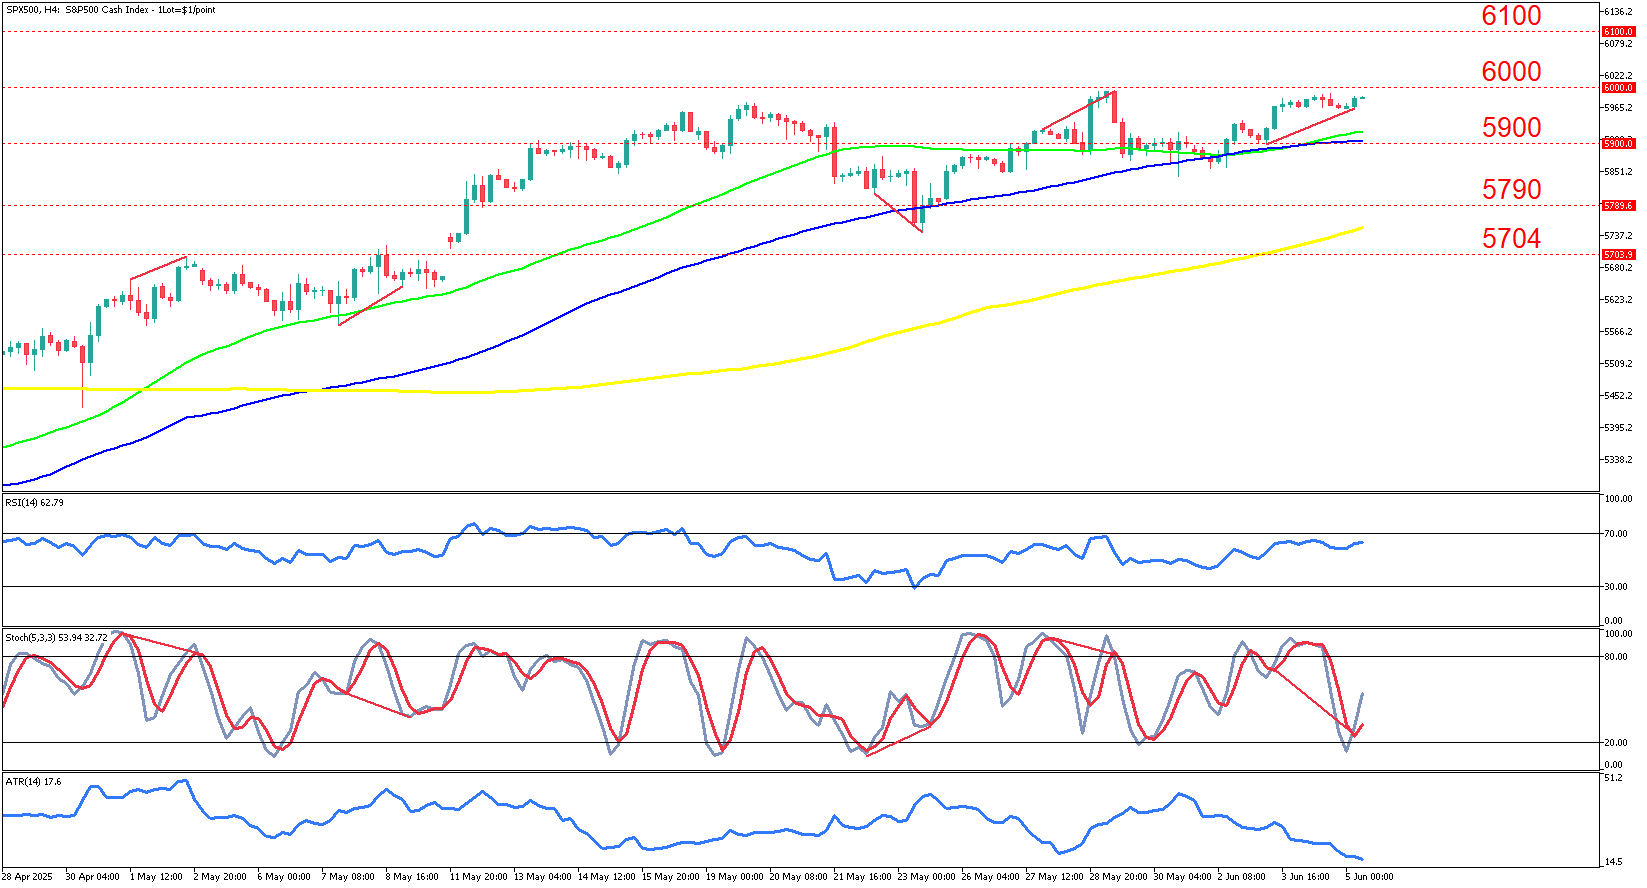
SPX500 on a 4-hour timeframe.
The index has sustained a bullish structure from late April through early June, marked by a clear sequence of higher highs and higher lows. Brief corrective pullbacks during this period have largely been technical in nature, finding support at the 50-period EMA and rarely threatening the longer-term bullish trajectory. Notably, previous consolidations around late April and mid-May resulted in strong bullish continuations, suggesting that the market remains structurally sound and guided by persistent buying interest.
More recently, SPX500 has hovered just beneath the 6000 psychological barrier after a sharp rally from the 5900 area. Price action over the past few sessions reflects consolidation just above the 50-period EMA and near-term support, with neither bulls nor bears showing decisive control. The brief intraday dip on June 3 was quickly reversed, confirming buyer presence and protecting the most recent higher low near 5900.
Technically, one of the most notable developments is the hidden bullish divergence forming between price and the stochastic oscillator. While price has printed higher lows, the stochastic indicator printed lower lows, often interpreted as a continuation signal within an established trend. Historically, such hidden divergences on this asset have tended to resolve in favor of the prevailing direction, which, in this case, remains bullish. RSI currently sits at 62.79, maintaining a supportive stance without signaling overextension. Price continues to trade comfortably above the 100-period and 200-period EMAs, reinforcing the uptrend bias. ATR values are trending lower, consistent with a consolidation phase.
The main scenario favors a bullish breakout above the 6000 handle. A confirmed close above this level would likely attract further momentum buying, with 6100 as the next technical target. The combination of hidden bullish divergence, supportive moving averages, and improving stochastic momentum favors this outcome, particularly if macro conditions remain accommodative.
Alternatively, a failure to clear 6000, especially if followed by a break below 5900, could open a retracement path toward 5790 or the 200 EMA near 5704. However, such a move would require either a technical breakdown or the emergence of a negative macroeconomic catalyst, as momentum and structure currently do not support a bearish reversal. Bearish divergence is absent from the current oscillators, and no major exhaustion signals are apparent at this time.
Fundamentally, recent macroeconomic releases have influenced market tone. On Monday, June 2, the May 2025 ISM Manufacturing PMI came in weaker than expected at 48.5 (vs. forecast 49.5), reinforcing expectations for looser monetary policy. However, on Tuesday, June 3, the JOLTS job openings report for April 2025 surprised to the upside, with 7.39 million openings versus 7.1 million expected, tempering some of the dovish sentiment. Nonetheless, rate cut expectations for 2025 remain firm, with markets pricing in approximately 50 basis points of easing. U.S. equities have responded favorably, with the S&P 500 advancing and the Nasdaq recovering its 2025 drawdown. This week’s key event is the Non-Farm Payrolls report, due Friday, June 6, 2025. Market participants will also be preparing for the June FOMC meeting, now confirmed for June 17–18, which will be pivotal for interest rate guidance.
Summary:
- SPX500 maintains a bullish structure with higher highs and lows since late April, supported by the 50-period EMA.
- Price consolidates just below the key 6000 level, showing buyer strength with quick reversals after dips near 5900.
- Hidden bullish divergence on the stochastic indicator signals trend continuation, backed by steady RSI and EMA support.
- A breakout above 6000 could trigger further gains toward 6100, while a drop below 5900 risks a retracement toward 5790 or the 200 EMA.