


Yesterday afternoon saw a rise in volatility for the first time this week as investors re-entered the market for 2 reasons. Investors again bought equities, specifically the NASDAQ, during the Federal Reserve Chairman's speech. During the speech, Mr. Powells confirms the regulator supported further rate hikes but did refuse to criticize loosening financial conditions.
Market participants paid specific attention to the positive comments rather than the hawkish statement on hikes. This is something we have experienced throughout the past 2-months as many traders continue to price in cuts towards the end of the year. In addition to this, the US President’s congress speech has been influencing investors. President Biden confirms that no default is on the cards and supports congress in raising the debt ceiling. The move supports stability and can support the stock market.
NASDAQ
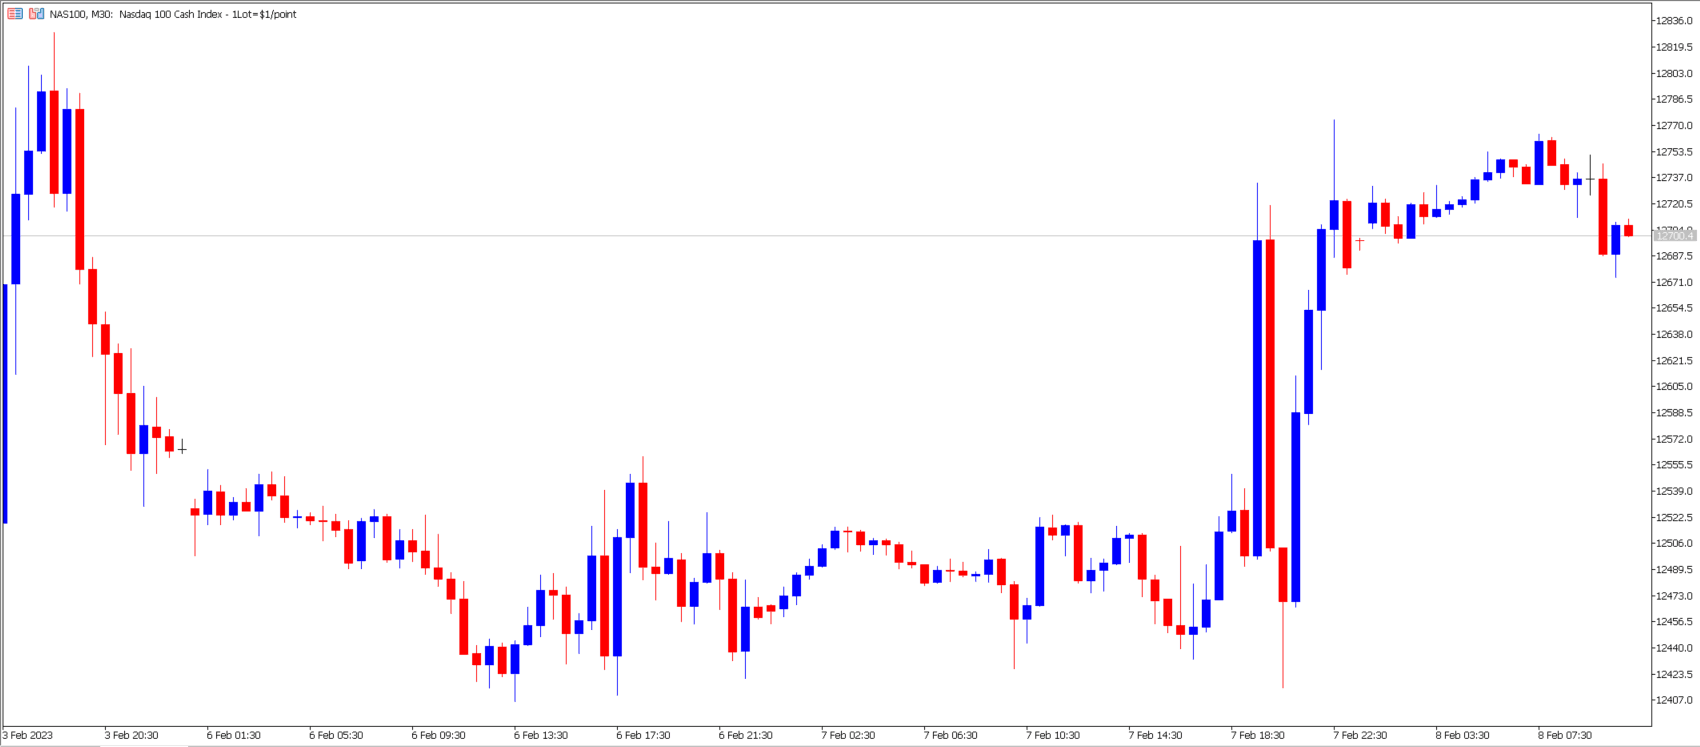
The NASDAQ had declined for 2 consecutive days but has formed no more than a retracement in the bullish trend, which started on January 6th. The NASDAQ ended the day on a 1.90% increase but also increased in value during this morning’s Asian Session. The index’s most recent high was last Thursday and reached a high of $12,898. The price is currently trading at $12,750.
Technical analysis follows similar indications as the past week, but trend indications have gained momentum over the previous session. The price trades daily in the bullish zone of envelopes, regression channels, and trading clouds. This provides a clear indication that bulls currently hold control of the market. After the bullish price moment, the asset obtained bullish indications from moving average crossovers and the stochastic oscillator. However, buyers remain cautious of the resistance between $12,830 and $12,897.
Earnings season for the technology sector has been mixed but has definitely shown a slowdown in economic growth. The NASDAQ originally saw support from earnings from Tesla and Meta (Facebook), but the mood was dampened by underachieving tech-companies such as Apple and Alphabet. Nonetheless, investor confidence and overall risk appetite within the trading markets have risen over the past month.
The index has also been supported by a slightly dovish tone by the Chairman of the Federal Reserve over the past 2 months. However, as previously mentioned, investors have tended to listen to dovish comments and ignore bullish notes. For example, the Chairman did advise that the regulator will keep hiking, and yesterday the FOMC announced that the Fed should consider being more restrictive.
Nonetheless, the CPI figure will be the main influencing factor for the monetary policy, the US Dollar, and US Stocks. Investors hope inflation continues to decline, but many economists advise that the decline's pace may slow.
Dow Jones Trades Within a Reverting Pattern
The investment market is happy to see the return of bulls to the equities market after a difficult second half of 2022. However, the Dow Jones index has seen limited bullish movement. The Dow Jones has come under pressure from poor earning reports, especially from the banking sector but also from sectors hit by lower consumer spending.
The worst-performing stocks for the Dow Jones over the past 24 hours were Verizon Communications Inc which declined by 1.77%, and Home Depot by -1.24%. Technical analysts have also noted that the Dow Jones is not within the trend but trading within a reverting price pattern. So, what does this mean for traders following technical analysis? Take a look at our latest technical analysis video below:
XAU/USD
The price of Gold has come under pressure from the Dollar’s attempted correction and higher investor confidence. The rise in confidence potentially can lead to lower demand for safe-haven assets such as Gold. However, the higher investor sentiment can only continue if the global economy can avoid a global downturn.
However, even if there is a price decline, economists do not believe the price of Gold will significantly decline to previous price ranges seen before 2019. In 2022, the demand for Gold coins and bars was recorded above 1,200K Tons. This is the highest level of demand the market has experienced in over 10 years and exceeds 2020’s demand levels of 0.904K tons.
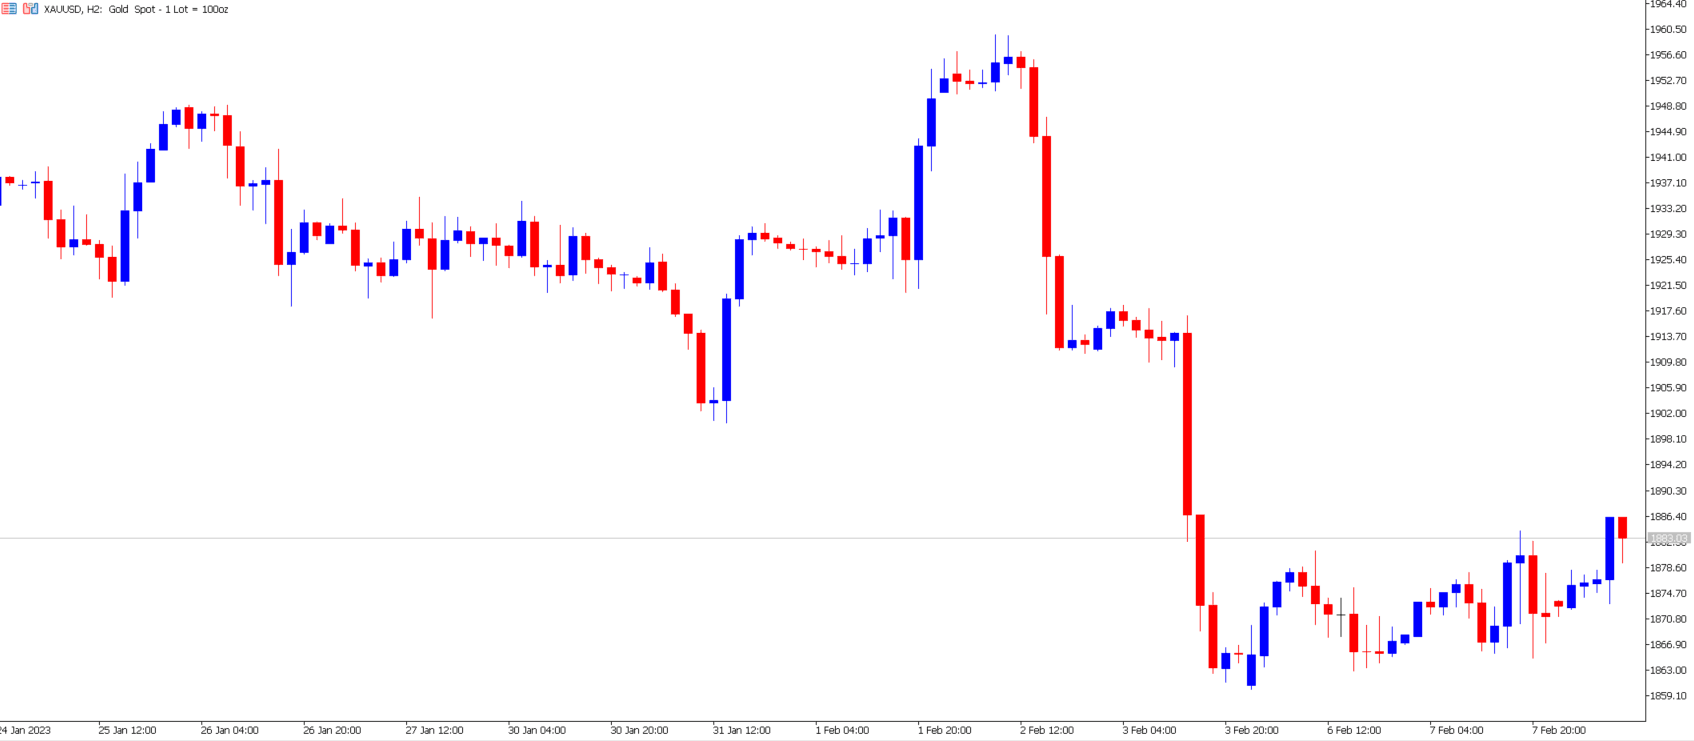
Technical analysis indicates that the price of Gold is experiencing a retracement before a further decline. After a strong breakout, which was experienced on February 2nd, the price does tend to return to its previous breakout level before further declining. Currently, the Moving Averages cross downwards, and the price is still below the 150 SMA, indicating that the price can still fall. However, this can change if the price exceeds the 150 Simple Moving Average.
Summary:
- Bulls return to the NASDAQ as investors grab onto dovish comments from the Federal Reserve Chairman.
- Mr. Powells confirms that the Central Bank needs to stick to its policy but refuses to criticize a softer policy.
- The Dow Jones continues to struggle compared to other US indices. The worst-performing stocks for the Dow Jones over the past 24 hours were Verizon Communications Inc which declined by 1.77%, and Home Depot by -1.24%.
- Gold received bearish indications from technical analysis but still is experiencing higher demand than in prior years.