


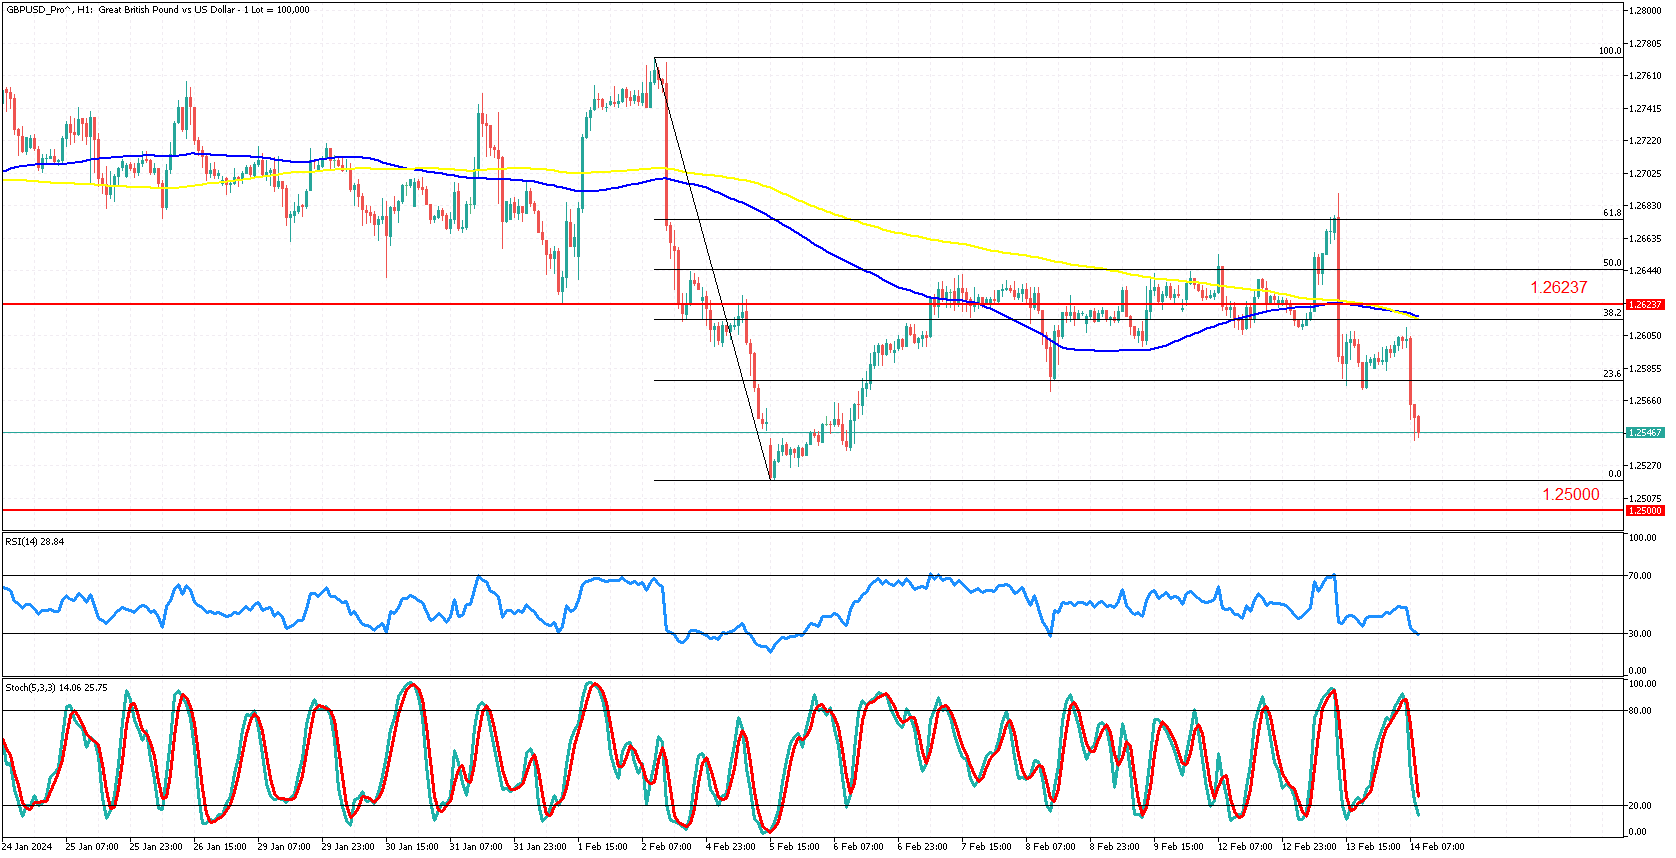
On an hourly timeframe, $GBPUSD traded sideways from mid-January 2024 until February 1st. The onset of February saw significant fluctuations in the first week.
A strong rally occurred on February 1st, followed by a rapid decline on February 2nd, lasting for three days. This decline, from February 1st to February 5th, serves as the base leg for our Fibonacci retracement.
The market remained stable within a trading range, except for two notably large bearish candlesticks. These candlesticks indicate a substantial presence of sellers, leading to a downturn in $GBPUSD, offering insight into potential future market direction.
Our bearish bias is reinforced by the market's failure to close above the 61.8 Fibonacci retracement level. Instead, it touched the 61.8 level and then formed a textbook-style reversal, marked by two large bearish candlesticks.
The market adhered to Fibonacci ratios and traded towards an area where the 38.2 Fibonacci level, resistance at 1.26237, and both the 100 and 200-period simple moving averages converged. This convergence presents a formidable area of resistance, posing a challenge for bullish momentum. Notably, a second bearish candlestick formed soon after touching this area, making it a crucial benchmark for invalidating any short setups. The next potential target for a bearish move might be the psychological level of 1.25000.
Presently, the odds favor the bears for the medium-term future. However, signs indicating a possible surprise bull run shouldn't be overlooked. Both the RSI and Stochastic oscillators are oversold, a cautionary signal for a potential short-term reversal to the upside.
A strong hammer candlestick pattern formed in line with the February 5th gap. Nonetheless, it's crucial to note that if the market remains below the 1.26237 area, it may present better opportunities for sell entries.
Exercise patience when determining which support and resistance levels will hold.
Summary:
- The market witnessed a strong rally on February 1st, followed by a rapid decline on February 2nd.
- Two notably large bearish candlesticks signal a substantial seller presence, leading to a decline in $GBPUSD. The market has also adhered to Fibonacci ratios, support/resistance levels, and the 100/200-period simple moving averages.
- If $GBPUSD remains below 1.2623, a potential move towards the 1.2500 level is anticipated.
- Conversely, breaching the 1.2623 level would invalidate a short scenario.
- Oversold RSI and Stochastic oscillators caution of a potential short-term reversal to the upside.
- Exercise patience when determining respected support and resistance levels.


