


Past performance is not indicative of future results. All historical data, including but not limited to returns, volatility, and other performance metrics, should not be construed as a guarantee of future performance.
DAX 1-hour timeframe
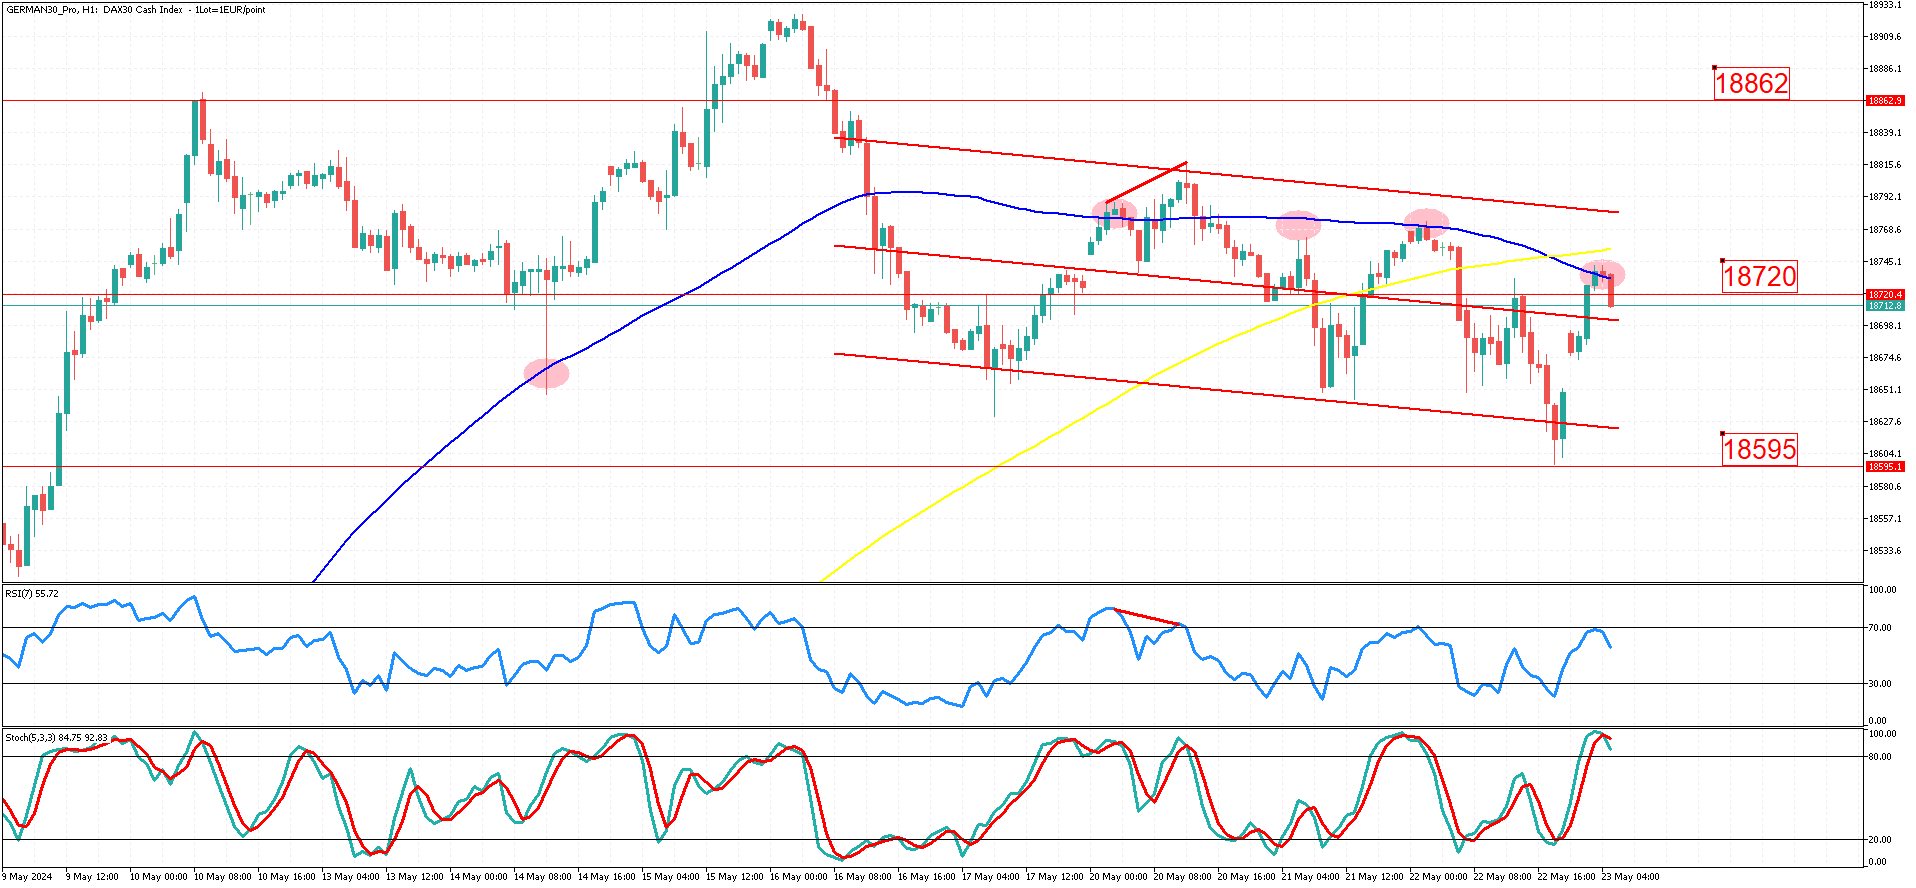
The German30, also known as the $DAX30, has been on a consistent uptrend since the low of 17452 on 19th April, trading on the hourly timeframe. It continued to appreciate until it reached a historical all-time high at 18924 on 16th May 2024. As expected, volatility increased significantly after reaching this new historical high. As volatility has eased a bit, a downtrend has emerged with consistent lower lows and lower highs, all within a neatly structured channel.
From a technical perspective, the near-term bias is to the downside, with the price action attesting to this (lower lows and lower highs). The 100 and 200-period simple moving averages also suggest bearish momentum.
Notably, the 100-period simple moving average is widely respected as a dynamic support and resistance level for the DAX on the hourly timeframe (rejections of the moving average depicted in red circles).
We are currently trading in the upper half of a downward-sloping channel, accompanied by a recent overbought scenario in both the RSI and Stochastic indicators. Additionally, the market has shown some reaction at the level of 18720, which could serve as a crucial resistance level.
If the price remains below the 18862 level, we can expect potential retracements towards the bottom of the price channel and possibly even the 18595 level.
However, it's important to note that the DAX has reached several new all-time highs in the past few weeks, indicating a long-term bullish trend supported by favorable fundamentals. As a result, if the market approaches the recent all-time highs, we may see the price start another push higher.
A convincing move above 18862 and a subsequent breakout of the price channel could potentially lead to 18924 and beyond.
Be vigilant for any changes in fundamental factors or shifts in investor sentiment.
Summary
- Hourly DAX exhibits a downtrend within a channel after reaching new highs.
- Near-term bias is bearish, confirmed by lower lows and lower highs.
- 100-period SMA acts as a critical support/resistance level.
- Overbought conditions in RSI and Stochastic suggest potential pullback.
- Levels to watch: 18862 (resistance), 18720 (resistance), 18595 (support).
- Long-term bullish trend remains intact, subject to fundamental factors.


