





Tape reading is a trading approach that helps traders interpret real-time market activity by studying executed trades, price movements, trading volume, and buying and selling pressure. While the technique dates back to the early days of financial markets, modern technology has transformed how traders access and analyze this information.
Today, tape reading in trading is particularly relevant to short-term and day traders who want to understand how market participants are behaving in real time. By analyzing bid and ask prices, trade size, order speed, and market activity, traders can identify potential entry and exit opportunities and gain a clearer view of short-term price movements. In this guide, we explain what tape reading is, how it works, the key techniques and tape reading strategies traders use, its advantages and limitations, and how it can be combined with other forms of market analysis.
Tape Reading – Key Takeaways
- Tape reading gives traders a real-time view of market activity by analyzing price, volume, trade size, execution speed, and buying and selling pressure.
- Tape reading strategies can help traders identify potential entry and exit opportunities, confirm breakouts, assess momentum, and better understand how buyers and sellers are interacting in the market.
- Tape reading can be particularly useful for day traders and short-term traders, but it requires practice and should be combined with technical analysis, price action, volume, and broader market context rather than used in isolation.
- NAGA provides access to market data, charts, and trading instruments that can help traders apply tape reading in trading while developing their market analysis and risk-management skills.
Alternatively, use our advanced technical insights tools such as Trading Central for pattern recognition or copy the moves of top performing traders in real time with NAGA Autocopy.
What Is Tape Reading in Trading?
Among the many trading strategies used to analyze financial markets, tape reading focuses on real-time market activity and the balance between buying and selling pressure. Traders examine information such as executed trades, price, trading volume, bid and ask prices, and the size and frequency of orders to assess how market participants are behaving.
The technique is also known as “time and sales” and has its roots in the ticker tapes used by traders in the late 19th and early 20th centuries. These tapes displayed information such as a stock’s ticker symbol, price, and trading volume, allowing traders to follow market activity as trades were executed.
The origins of tape reading can be traced to the development of stock ticker technology in the late 1800s. Early ticker tapes transmitted trading information through telegraph systems, giving traders access to continuously updated market prices and transaction information. As electronic communication and computerized trading developed, physical ticker tapes eventually became obsolete.
Modern tape reading in trading applies the same underlying principle using electronic market data. Instead of watching a physical ticker tape, traders can use time and sales feeds and order books to observe how trades are executed and how buying or selling pressure may be developing.
While tape reading is particularly associated with day trading and other short-term approaches, interpreting the tape involves more than watching individual transactions. Traders need to understand how price, volume, order size, execution speed, and the broader market context interact before using this information as part of a trading decision.
According to Frank Walbaum, Market Analyst and former hedge fund manager, learning tape reading starts with understanding how buying and selling activity influences price movements. Traders should pay attention to how quickly orders are executed, how price reacts to that activity, and whether the market is moving convincingly through important levels. One of the biggest mistakes beginners make is treating every transaction or sudden burst of activity as a reliable trading signal. Tape reading should instead be used as part of a broader trading strategy, with the focus on building experience, managing risk and developing consistency over time.
— Frank Walbaum, Market Analyst, former hedge fund manager
How Does Tape Reading Work?
Modern tape reading works by analyzing real-time market data to identify changes in buying and selling activity. Rather than relying only on historical price charts, traders observe how trades are being executed and how orders interact with the market at different price levels.
The main sources of information include the time and sales feed and the electronic order book. Time and sales shows completed transactions, including the price, size, and timing of trades, while the order book provides information about current bid and ask prices and the orders waiting to be executed.
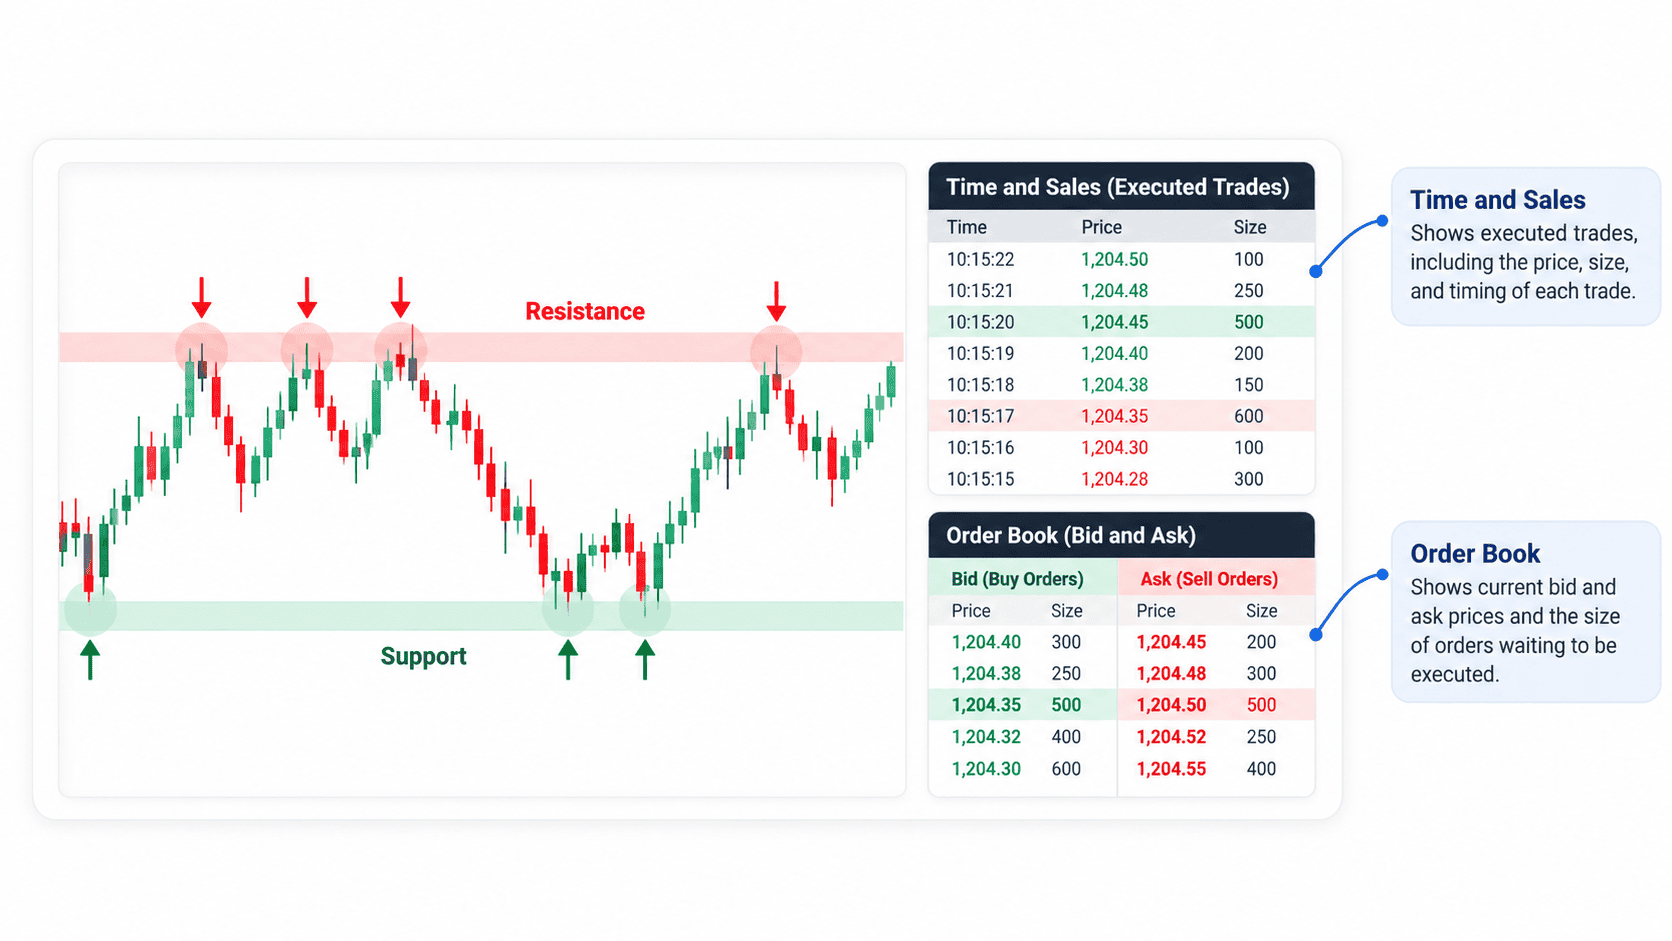
By observing these details together, traders can assess whether buying or selling pressure appears to be increasing. For example, a concentration of large buy orders below the current market price may suggest potential support, while significant sell orders above the current price may indicate potential resistance. However, these observations are not guarantees of future price movements and should be interpreted in the broader market context.
The speed and frequency of trades can also provide useful information. A rapid increase in transactions may indicate stronger market participation, while changes in order size and execution activity can help traders determine whether a price movement is gaining or losing momentum.
The key is therefore not to focus on one order or transaction in isolation. Tape reading is about interpreting the relationship between price, volume, orders, and execution activity to build a clearer picture of what is happening in the market in real time.
Learn more about order types in trading.
How to Read the Tape in Trading
Learning how to read the tape requires traders to look at several pieces of market information at the same time rather than relying on a single transaction or order. The objective is to understand whether buying or selling pressure is strengthening, weakening, or changing as the market moves.
A practical approach is to focus on the following:
Monitor Price and Volume
Price and volume provide the basic context for interpreting activity on the tape. A price movement accompanied by stronger trading activity may provide more meaningful information than a similar move occurring with limited participation.
Analyze Bid and Ask Activity
Watching the bid and ask prices can help traders assess whether buyers or sellers are becoming more aggressive. Changes in the size and activity of orders around these levels may provide additional context when evaluating potential support or resistance.
Watch Order Size and Speed
Large orders can attract attention, but their size alone does not determine the market's next direction. Traders can also monitor how quickly transactions are being executed and whether trading activity is accelerating or slowing down.
Look for Changes in Buying and Selling Pressure
The most useful signals often come from changes in market behavior rather than a single order. When price, volume, and execution activity move in the same direction, traders may gain stronger confirmation for a potential entry or exit decision.
This is also why tape reading has a learning curve. Traders need practice interpreting several streams of information simultaneously and distinguishing meaningful market activity from short-term noise.
What Information Can Traders Get From the Tape?
The tape can provide traders with a real-time view of market activity that is not always apparent from price charts alone. By combining different types of market data, traders can develop a better understanding of how buyers and sellers are interacting at a given moment.
- Price and Trade Direction: Tracking executed trades and price changes can help traders identify whether buying or selling activity is becoming more dominant. Repeated transactions at higher or lower prices may provide clues about the current direction of short-term market activity.
- Volume and Trade Size: Trading volume and order size can help traders assess the strength behind a price movement. Larger or increasing transaction sizes may indicate greater participation, although they should always be considered alongside other market information.
- Bid-Ask Activity: The bid and ask show the prices at which market participants are willing to buy or sell. Changes in these levels and the orders around them can help traders identify potential areas of buying or selling pressure.
- Trade Speed and Frequency: The speed and frequency of transactions can reveal changes in market activity. A sudden increase in trading speed may indicate stronger participation or growing momentum, while slower activity can suggest that market interest is weakening.
- Identifying Buying and Selling Pressure: The most useful signals often come from changes in market behavior rather than a single order. When price, volume, and execution activity move in the same direction, traders may gain stronger confirmation for a potential entry or exit decision.
- Spotting Large Orders: Large orders can draw attention to specific price levels and may indicate areas where significant market interest exists. However, traders should consider whether these orders are actually being executed and combine them with other tape signals before making a decision.
- Confirming Breakouts: Tape activity can help traders assess whether a price breakout is supported by stronger market participation. Increased volume and execution activity in the direction of the breakout may provide additional confirmation rather than relying on the price move alone.
Tape Reading Trading Strategies
Tape reading strategies can help traders interpret real-time market activity and use changes in order flow to support trading decisions. Rather than relying on a single signal, traders typically combine tape information with price action, volume, technical indicators, and broader market conditions to identify potential opportunities.
Combining Tape Reading with Technical Indicators
Tape reading is primarily based on real-time market activity rather than technical indicators. However, traders can combine tape information with indicators and other forms of technical analysis to add context and confirmation to their trading decisions.
For example, moving averages can help traders identify the prevailing market trend, while support and resistance levels can highlight areas where buying or selling pressure may become more significant. Volume-based tools can also help traders assess whether a price movement is supported by stronger market participation.
Momentum indicators such as the Relative Strength Index (RSI) can provide additional context when a market appears overbought or oversold, although they should not be treated as a direct tape reading signal. The tape can then be used to observe whether real-time buying or selling activity supports the potential setup identified through technical analysis.
This combination allows traders to use technical indicators to establish the broader market context and tape reading to assess how market participants are behaving in real time. Rather than replacing technical analysis, tape reading can therefore serve as an additional layer of confirmation when evaluating potential trades.
Technical Indicators and Their Role in Tape Reading
Technical Tool Role Alongside Tape Reading Example Use Moving Averages Identify the broader market trend Assess whether buying or selling activity is occurring in line with the prevailing trend Support and Resistance Identify important price levels Watch tape activity for changes in buying or selling pressure near these levels Volume Indicators Assess market participation Compare price movements with changes in trading activity RSI Provide momentum and overbought/oversold context Use tape activity to look for confirmation around potential reversal areas This table shows how selected technical tools can provide context and additional confirmation when combined with tape reading, rather than serving as direct tape reading signals.
Key Tape Reading Strategies
Tape reading strategies can be applied in different market conditions and trading situations. The following approaches show how traders can use real-time market activity to assess potential opportunities, confirm price movements, and make more informed entry and exit decisions.
Key Tape Reading Strategies
Strategy How It Works Support and Resistance Tape readers can monitor buying and selling activity around important price levels to assess potential support or resistance. Price Action Confirmation Traders can use tape activity to confirm whether buying or selling pressure supports a potential price action setup. Entry and Exit Decisions Changes in trade activity can provide additional information when evaluating potential entry or exit points. Breakout and Momentum Trading Traders can monitor volume, execution speed, and market activity to assess whether a breakout is supported by stronger participation. Range Trading Tape activity around the upper and lower boundaries of a range can help traders assess changes in buying or selling pressure. Reading Order Flow Traders observe how buy and sell orders interact as trades are executed to assess changes in market pressure. This table highlights common tape reading strategies and how traders can use real-time market activity to assess buying and selling pressure, confirm price movements, and support trading decisions.
Tape Reading Across Markets and Day Trading
Although tape reading is often associated with stocks and day trading, the approach is not limited to a single asset class. The same principles can be applied across financial markets where traders have access to real-time information on prices, transactions, volume, and market activity.
The technique can be particularly useful for day traders and other short-term traders because it allows them to monitor changes in market activity as they develop. Instead of relying only on historical price movements, traders can observe changes in buying and selling pressure, trade frequency, volume, and order activity while evaluating a potential position.
Liquidity is also an important consideration. More active markets generally provide a greater flow of transactions and price information to analyze, while thinner markets may provide fewer signals and can make individual transactions appear more significant than they actually are.
A Practical Tape Reading Example
Consider Gold (XAU/USD) on a 15-minute chart. In the NAGA screenshots used for this example, gold is trading around $4,126.94, with the displayed daily range extending from $4,124.60 to $4,184.02. The chart also shows a recent decline from the $4,170–$4,180 area toward the $4,120–$4,130 zone, while the displayed volume in the screenshots is 523 and 660 at different points in the session.
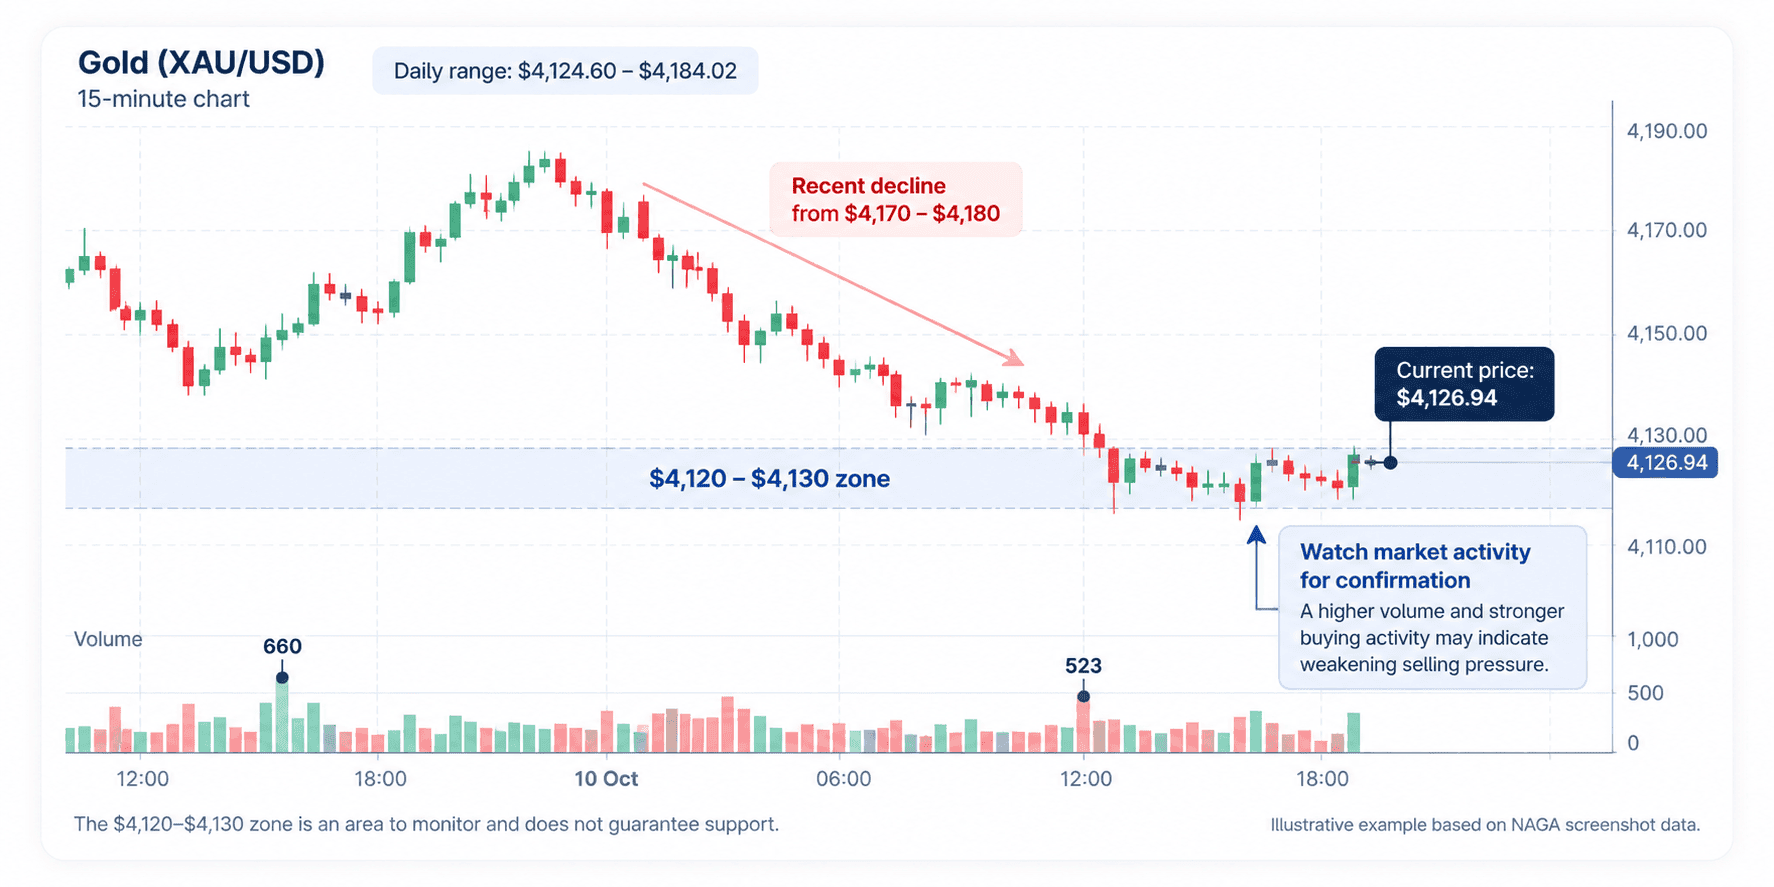
A trader using tape reading would not simply assume that the $4,120–$4,130 area will act as support because the price has reached it. Instead, they would watch how market activity develops around this zone. If buying activity begins to increase, transactions accelerate, and the price starts moving back above $4,130, these signals could provide additional confirmation that selling pressure is weakening.
On the other hand, if trading activity increases while the price continues to fall through the area, this could indicate that sellers remain in control. In that situation, the trader may wait for further confirmation rather than entering a position simply because the price has reached a previously observed level.
The example illustrates an important principle of tape reading: the goal is not to predict the next price movement from a single number or transaction. Instead, traders interpret changes in price and market activity together and use that information alongside their broader trading strategy.
Tape Reading vs. Other Types of Market Analysis
Tape reading focuses primarily on real-time market activity, but it can be combined with other forms of analysis to provide a broader view of potential trading opportunities.
Tape Reading vs. Other Types of Market Analysis
Analysis Type Main Focus How It Can Complement Tape Reading Tape Reading Real-time trades, price activity, and order flow Helps traders assess current buying and selling pressure Technical Analysis Price patterns, trends, support and resistance, and indicators Helps identify market structure and potential trading setups Fundamental Analysis Economic, financial, and market factors Provides broader context for potential price movements Volume Analysis Trading activity and market participation Helps assess the strength behind a price movement
No single approach provides a complete picture of market behavior. Combining tape reading with technical, fundamental, or volume analysis can help traders place short-term market activity into a broader context before making a trading decision.
Tape Reading: Key Benefits, Limitations and Common Mistakes
Tape reading can give traders a more detailed view of real-time market activity, particularly when they want to understand changes in buying and selling pressure. However, the information available on the tape can also be difficult to interpret, especially in fast-moving markets, so traders need to understand both its potential benefits and its limitations.
One of the most common mistakes is relying on a single large order. A large order may attract attention, but it does not necessarily mean that the market will move in the expected direction. Traders should look at how orders are executed and whether other market signals support the same interpretation.
Another mistake is ignoring the broader market context. Tape activity can change quickly, and a trader who focuses only on individual transactions may overlook important price levels, trends, volatility, or other factors affecting the market.
Traders can also confuse order size with market direction. Large transactions can be important, but their presence alone does not establish whether buyers or sellers are ultimately in control. Similarly, reacting too quickly to every change in the tape can lead to unnecessary trades and emotional decisions.
Finally, using tape reading in isolation can provide an incomplete view of the market. Combining it with technical analysis, volume, price action, or fundamental information can help traders put real-time market activity into a broader context.
Walbaum also points out that distinguishing genuine buying or selling pressure from temporary market noise is one of the main challenges of tape reading. A sudden increase in activity does not necessarily mean that a trend will continue, and aggressive buying or selling can sometimes be absorbed by opposing orders without causing significant price movement. For this reason, traders should consider the broader market context and how price responds to trading activity rather than relying on a single signal. Combining tape reading with key price levels and a predefined trading strategy can help reduce impulsive decisions and improve consistency.
— Frank Walbaum, Market Analyst, former hedge fund manager
The following table summarizes the main benefits and limitations to consider:
Tape Reading Benefits and Limitations
Aspect Benefits Limitations / Considerations Real-Time Data Provides insight into current market activity Requires constant attention and quick interpretation Price Movement Helps traders understand short-term price behavior Does not guarantee the next price direction Order Flow Provides clues about buying and selling pressure Individual orders can be misleading Entry and Exit Decisions Can provide additional confirmation for trade decisions Signals should be assessed alongside other market information Short-Term Trading Particularly useful for active and day traders Fast-moving markets can make the information difficult to follow Learning Curve Basic concepts can be learned progressively Developing professional-level skills requires significant practice
Overall, tape reading can be a useful addition to a trader's toolkit, but its effectiveness depends on how the information is interpreted. Understanding its limitations and avoiding common mistakes is just as important as learning how to identify potential signals.
How to Start Using Tape Reading with NAGA
NAGA provides traders with access to charts, market data, and trading instruments that can support the practical application of tape reading alongside broader market analysis.
- Choose a liquid instrument: Start with an actively traded market and focus on one instrument while learning.
- Study market activity: Use available price and volume data to observe how trading activity changes as the market moves.
- Practice before trading: Monitor price movements and market activity without immediately opening positions to build experience.
- Combine your analysis: Use tape reading alongside technical analysis, price action, and volume to build a more complete trading view.
- Manage your risk: Define your potential loss and use appropriate risk-management tools rather than treating tape signals as guaranteed predictions.
The Bottom Line
Tape reading gives traders a real-time perspective on market activity by focusing on price, volume, trade size, execution speed, and buying and selling pressure. While it can be particularly useful for short-term and day trading, the approach can be applied across different financial markets and should not be limited to a single asset class.
Successful tape reading requires practice and market awareness, as individual orders or transactions do not necessarily indicate where prices will move next. Combining tape reading with technical analysis, volume, price action, and sound risk management can help traders make more informed decisions.