


As a technical trader or investor, one of the most useful trading abilities you can develop is the ability to recognize price patterns. To execute trades based on price action signals, traders are searching for price patterns that may indicate shifts in the market's trend. Mastering the most popular price patterns can also help you make predictions about market reversals and trend continuations.
Rising and falling wedge chart patterns are frequently used by traders to spot potential price reversals or continuations. The direction of the wedge's breakout determines whether the price will maintain its previous trend or if it will reverse it. These easy-to-spot and understand patterns are also recognized for their potential to offer advantageous risk/reward trading signals.
How to Trade Rising and Falling Wedge Pattern – Quick Guide
- Learn the principles of technical trading at NAGA Academy.
- Sign up for a live account and gain access to thousands of shares, indices, ETFs, currency pairs, cryptocurrencies, and more.
- Identify wedge patterns using our comprehensive charting tools, including advanced Trading View charts.
- Open and monitor your position.
Not ready to trade with real capital? Open a demo account to trial your price pattern strategy with $10,000 in virtual funds. Alternatively, copy the moves of top performing traders in real time with NAGA Autocopy.
What is a Wedge Pattern?
A wedge pattern is a predictive price pattern represented by two converging trendlines, where the price of an asset makes higher highs and higher lows (rising wedge), or lower highs and lower lows (falling wedge). The pattern is characterized by a narrowing price range between two trendlines resulting in a wedge shape as they converge towards each other.
There are two types of wedge pattern: rising wedge (which signals a bearish reversal or continuation) and falling wedge (which signals a bullish reversal or continuation).
In every scenario, a wedge pattern shares three common characteristics:
The trendlines (pattern's support and resistance) are converging
The volume tends to decrease as the price moves through the pattern
There is a breakout from one of the trendlines under increased volume
A wedge pattern can be either a continuation or a reversal pattern. This suggests that the price could break out of the wedge pattern and keep on with the asset's general trend direction. But the price might also break out of a wedge, interrupting a trend and initiating a new trend in the other direction. The pattern itself suggests that traders are still deciding where to take the price next and it signals a pause in the current trend.
It is considered that within a valid wedge pattern the price must test the converging trendlines at least five times (three times on one and twice on the other) before the breakout occurs. The price has a below-average performance and makes frequent retracements.
A wedge pattern can occur on all timeframes and is frequently seen in traded assets like forex, stocks, bonds, futures etc.
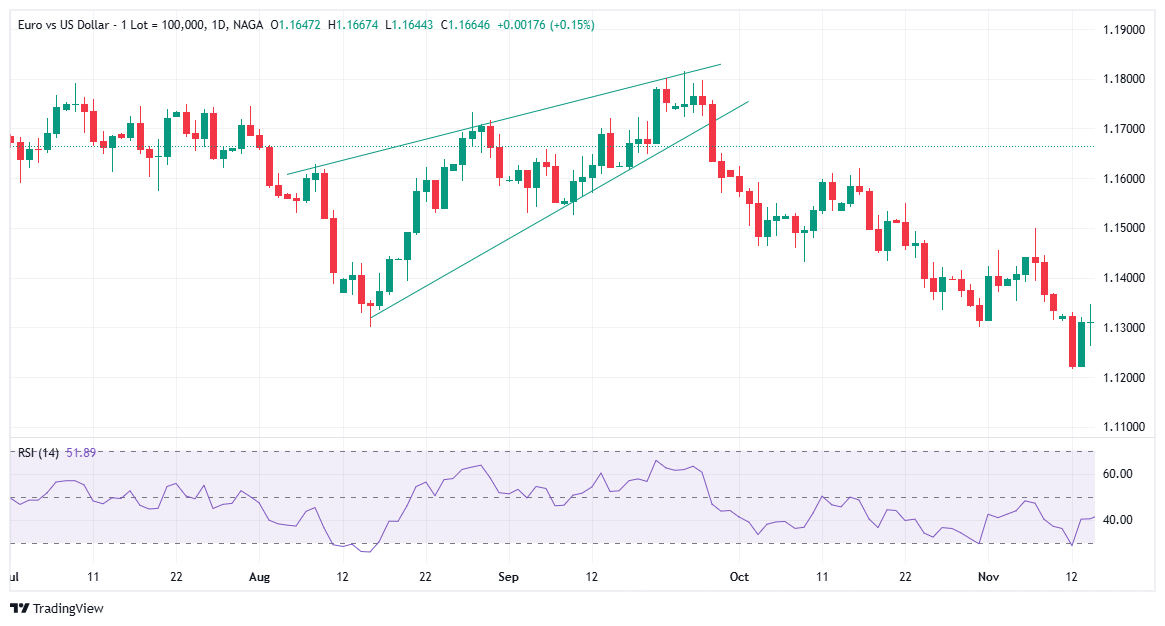
Rising Wedge Pattern (ascending wedge pattern)
A rising wedge, or an ascending wedge, is a bearish technical price pattern that can generate both reversal and continuation signals – depending on location and trend bias. It arises by drawing two ascending trendlines that are steeper in the top direction than the lower, and they both converge towards each other.
The rising wedge pattern is fundamentally bearish, so traders should always abide by this rule regardless of where the wedge appears.
From a visual perspective, a rising wedge occurs when the price makes higher highs but the distance between these points diminishes as the pattern matures. In essence, there is an upward movement in the price action, but decreasing price action indicates that the current momentum is waning.
Past performance is not a reliable indicator of future results. All historical data, including but not limited to returns, volatility, and other performance metrics, should not be construed as a guarantee of future performance.
When spotting a rising wedge pattern, traders should draw the support and resistance lines, as their slope will define if they are dealing with such a pattern or not. Rising wedge patterns usually go as follows: the chart will first show lower and higher highs, then a break of the support level may occur under increased volume. This suggests that the rising wedge pattern is complete, and a rapid decline could start soon after.
There is some confusion in identifying the rising wedge pattern because it is seen as both a bearish continuation and a bearish reversal pattern. It is necessary to consider that the two scenarios have some distinct monitoring mechanisms.
Here is how to correctly identify a rising wedge pattern:
Reversal rising wedge pattern
Continuation rising wedge pattern
- Look for an existing uptrend
- Check if price is making higher highs and higher lows
- Confirm the volume, which should diminish within the pattern and increase when the price breaks out
- Look for possible divergence between price and volume using indicators such as RSI or Stochastic
- Check for potential overbought signals confirmed by oscillators
- Wait for the breakout of the support line and prices reversal
- Look for an existing downtrend
- Check if price is making higher highs and higher lows
- Confirm the volume, which should diminish within the pattern and increase when the price breaks out
- Look for possible divergence between price and volume using indicators such as RSI or Stochastic
- Check for potential overbought signals confirmed by oscillators
- Wait for the breakout of the support line and prices reversal
Remember: A rising wedge pattern signals an upcoming downtrend, which makes it a bearish price pattern.
Learn more about trading indicators
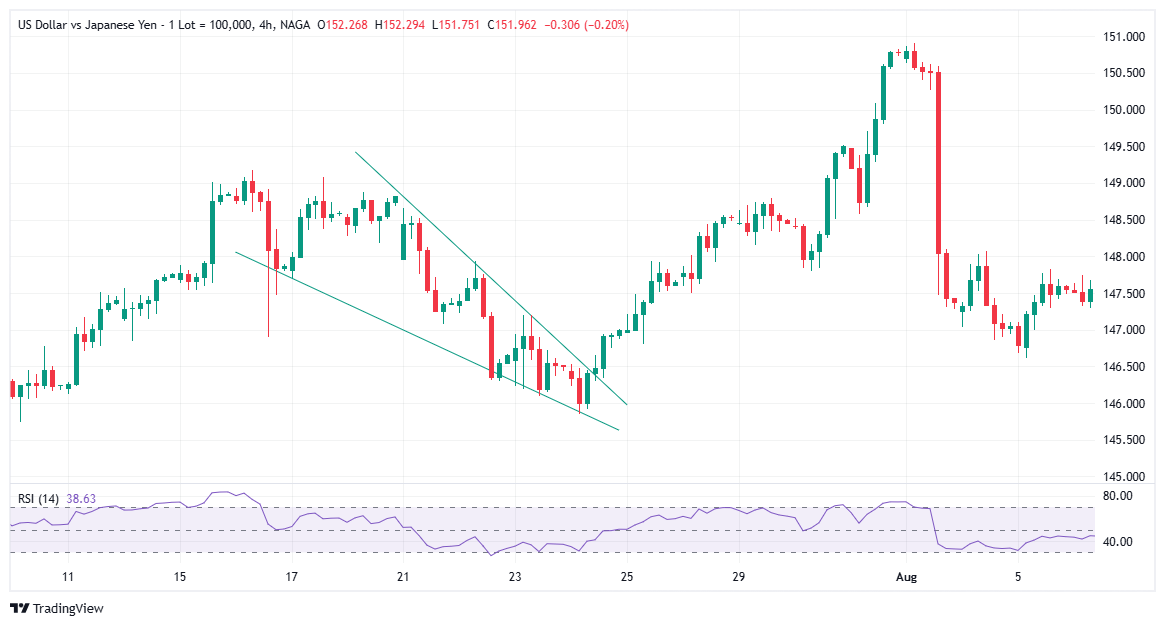
Falling Wedge Pattern (descending wedge pattern)
A falling wedge, also known as a descending wedge pattern, is a bullish pattern that arises when the price consolidates between two descending trendlines that converge towards the same point. The pattern signals the end of a corrective or consolidation period.
Buyers use price consolidation to create new buying opportunities, surpass the bears, and push prices upward. When the price breaks above the top trendline, usually accompanied by a significant price increase, the falling wedge pattern is confirmed.
Visually, it occurs when an asset's price falls, yet the range of price swings begins to narrow. As the pattern is about to be completed, buyers entirely absorb the selling pressure and consolidate their energy before attempting to push the price higher. A falling wedge pattern indicates the end of a price correction and an upside reversal.
Past performance is not a reliable indicator of future results. All historical data, including but not limited to returns, volatility, and other performance metrics, should not be construed as a guarantee of future performance.
Trading the falling wedge pattern requires a strategical approach in order to spot high-probability setups, enter at the right time, maximize potential targets, and control downside risks.
There is some confusion in identifying the falling wedge pattern because it is seen as both a bullish continuation and a bullish reversal pattern. There are differences in the market conditions between the two scenarios that need to be considered.
The direction of the trend at the point where the falling wedge occurs is what distinguishes the continuation from the reversal pattern. When a falling wedge occurs during an uptrend, it is a continuation pattern, while during a downtrend, it is a reversal pattern. Here is how to correctly identify a falling wedge pattern.
Reversal falling wedge pattern
Continuation falling wedge pattern
- Look for an existing uptrend
- Make sure price is making lower highs and lower lows
- Confirm the volume, which should diminish within the pattern and increase when the price breaks out
- Look for possible divergence between price and volume using indicators such as RSI or Stochastic
- Check for potential overbought signals confirmed by oscillators
- Wait for the breakout of the resistance line and prices reversal
- Look for an existing downtrend
- Make sure price is making lower highs and lower lows
- Confirm the volume, which should diminish within the pattern and increase when the price breaks out
- Look for possible divergence between price and volume using indicators such as RSI or Stochastic
- Check for potential overbought signals confirmed by oscillators
- Wait for the breakout of the resistance line and trend resuming
Remember: A falling wedge pattern signals an upcoming uptrend, which makes it a bullish price pattern.
Ascending Wedge Pattern vs Descending Wedge Pattern
It is essential to understand the main characteristics and the signal generated by the wedge patterns if you want to improve your trading strategy.
Rising Wedge
Falling Wedge
Shape Support and resistance lines that slope upwards Support and resistance lines that slope downwards Signal Bearish pattern Bullish pattern Breakout (validation) Breakout below the support trendline Breakout above the resistance trendline Learn more about technical analysis
Trading Rising and Falling Wedge Patterns – Step-by-Step Guide
As we discussed what wedge patterns are and how to correctly spot them, it is important to know how to trade them. When trading the ascending or descending wedge pattern, traders can apply different entry and exist strategies, depending on their risk tolerance and preferences. Below we will only highlight the main principles.
Step 1. Identify the Wedge Pattern
Spotting the wedge pattern on the chart is the first step. Identify a tightening price range and use trendlines for connecting the highs and lows. Keep in mind that an ascending wedge pattern signals a downtrend, while a descending wedge pattern signals an uptrend.
Step 2. Define SL & TP levels
Managing risks is a crucial component of trading. Determine your take-profit and stop-loss levels according to your trading plan and risk tolerance. Some traders will place their stop loss above the higher trendline if they go short, or below the lower trendline, if they go long. The height of the wedge pattern at its thickest point added to the breakout/entry point could serve as an approximation of the profit target.
Step 3. Evaluate the risk/reward
Seasoned traders always assess the risk/reward ratio before moving forward. The ideal ratio is at least 1:2, which means that reward should be twice as much as the risk. Making money over a long period of time will be more challenging if the potential returns are smaller than the risks, as losses will be greater than the gains.
Step 4. Wait for the breakout
Although you have identified the wedge pattern and decided that it could be an opportunity for you, wait for the confirmation before making a trade. Most of the time, the confirmation arrives once the price breaks out of the pattern. A breakout arises when the price soars above the resistance, whereas a breakdown occurs when the price falls below the support.
Step 5. Enter the market
If the price breaks above the upper trendline of a descending wedge, you may open a long position; if it breaks below the lower trendline of an ascending wedge, you could open a short position. Sometimes, price may retest the wedge's previous trendline. This may present an additional entrance point.
Step 6. Monitor your position
Always keep an eye on your trade and, if needed, don't hesitate to adjust it. If your prediction was correct and price moves in your favour, you could lock in profits using a trailing stop. In contrast, if you see that your prediction was wrong, and price moves against you, consider terminating your trade to reduce your losses.
Wedge pattern trading can be a part of both a short and a long-term trading strategy. It's crucial to keep in mind, though, that the pattern's depth and strength might be influenced by the timeframe. It could be harder to identify an intraday wedge pattern with much accuracy.
Usually, strong wedge patterns are preceded by well-defined trends which last for at least several months. It's also feasible that the wedge pattern itself incorporates all or most of a trend. In such a case, the wedge-signaled reversal could be a long-term reversal or an intermediate reversal inside the broader trend.
As result of consolidation after a strong trend, wedge patterns show a weakening rather than a strengthening of the preceding trend, in contrast to triangle patterns.
Advantages and Limitations of Using Wedge Patterns in Trading
Wedge patterns may offer traders interesting risk-reward setups when used prudently, with stringent entry rules and risk management strategies. Nevertheless, these setups still demand prudence as they require further confirmation via volume expansion and other indicators when looking for high-probability scenarios at the best possible times.
Advantages of Wedge Patterns in Trading
- Easy to recognize: Wedge patterns are easy to spot on a price chart, making them approachable to beginning traders.
- Early signals: A wedge pattern can help traders adapt their positions in advance of a big price move by indicating a possible trend reversal or continuation.
- Clear entry/exit points: The breakout direction—below the support for rising wedge pattern and above the resistance for falling wedge—offer clear entry and exit points, which allow traders to establish their positions and manage risk.
- Technical validation: The breakout often comes with an increased trading volume. To support a probable price movement, traders can also correlate it with additional technical indicators such as oscillators or moving averages.
Apart from the pros, as with any trading strategy, being aware of limitations is crucial if you want to wise them wisely.
Limitations of Wedge Patterns in Trading
- False breakouts: When prices briefly rise above the wedge resistance, or fall below support, before reversing quickly, traders are dealing with a false signal. Such a scenario can cause losses for traders who entered prematurely.
- Challenging to detect in real-time market conditions: Identifying and interpreting a wedge pattern in real time can involve subjectivity. Traders may have different opinions on whether a wedge pattern is forming or not and they often identify it incorrectly.
- Requires additional confirmation: Relying only on the pattern may result in missed chances or inaccurate predictions. Always enhance your pattern analysis with other technical indicators (especially volume), fundamental analysis, and market sentiment.
- Can be confused with other price patterns: Ascending and descending wedge patterns are frequently confused by novice traders with ascending or descending triangles, flags or pennants.
In conclusion, while wedge patterns can provide useful insights, traders must be aware of their drawbacks and use them wisely alongside other charting features and technical indicators.
Learn more about NAGA platform
Final Words
The rising and falling wedge are flexible chart patterns in technical analysis that can signal a trend continuation or reversal. They frequently show up in a variety of shapes and sizes, and they serve as a warning that the bulls and bears are currently involved in an intense battle. The winner as well as where a trader may want to position himself in the supply and demand equation will be revealed by the breakout direction.
Wedges are important price patterns that can give traders an advantage in the market. Identifying them correctly and early allows traders to initiate or exit trades based on market fluctuations. Alongside prudent risk and money management practices, they can be a very useful tool for traders interested in benefitting from potential market moves.
However, once we identify a wedge pattern, it is critical to investigate its nuances, validate its signals with other indications, and maintain a holistic approach. Within the dynamic environment of financial markets, a wedge pattern emphasizes the need to be vigilant, adapt rapidly and continuously improve our trading skills.
Free resources
Before you start trading chart patterns, you should consider using the educational resources we offer like NAGA Academy or a demo trading account. NAGA Academy has lots of free trading courses for you to choose from, and they all tackle a different financial concept or process – like the basics of analyses – to help you to become a better trader or make more-informed investment decisions.
Our demo account is a suitable place for you to get an intimate understanding of how trading and investing work – as well as what it’s like to trade with leverage – before risking real capital. For this reason, a demo account with us is a great tool for investors who are looking to make a transition to leveraged securities.
Sources:
https://chartpatterns.com
https://www.cfainstitute.org/en/membership/professional-development/refresher-readings/technical-analysis
https://research.stlouisfed.org/wp/more/2011-001